Russian vs Cherokee Married-couple Households
COMPARE
Russian
Cherokee
Married-couple Households
Married-couple Households Comparison
Russians
Cherokee
48.2%
MARRIED-COUPLE HOUSEHOLDS
98.1/ 100
METRIC RATING
80th/ 347
METRIC RANK
46.7%
MARRIED-COUPLE HOUSEHOLDS
65.7/ 100
METRIC RATING
166th/ 347
METRIC RANK
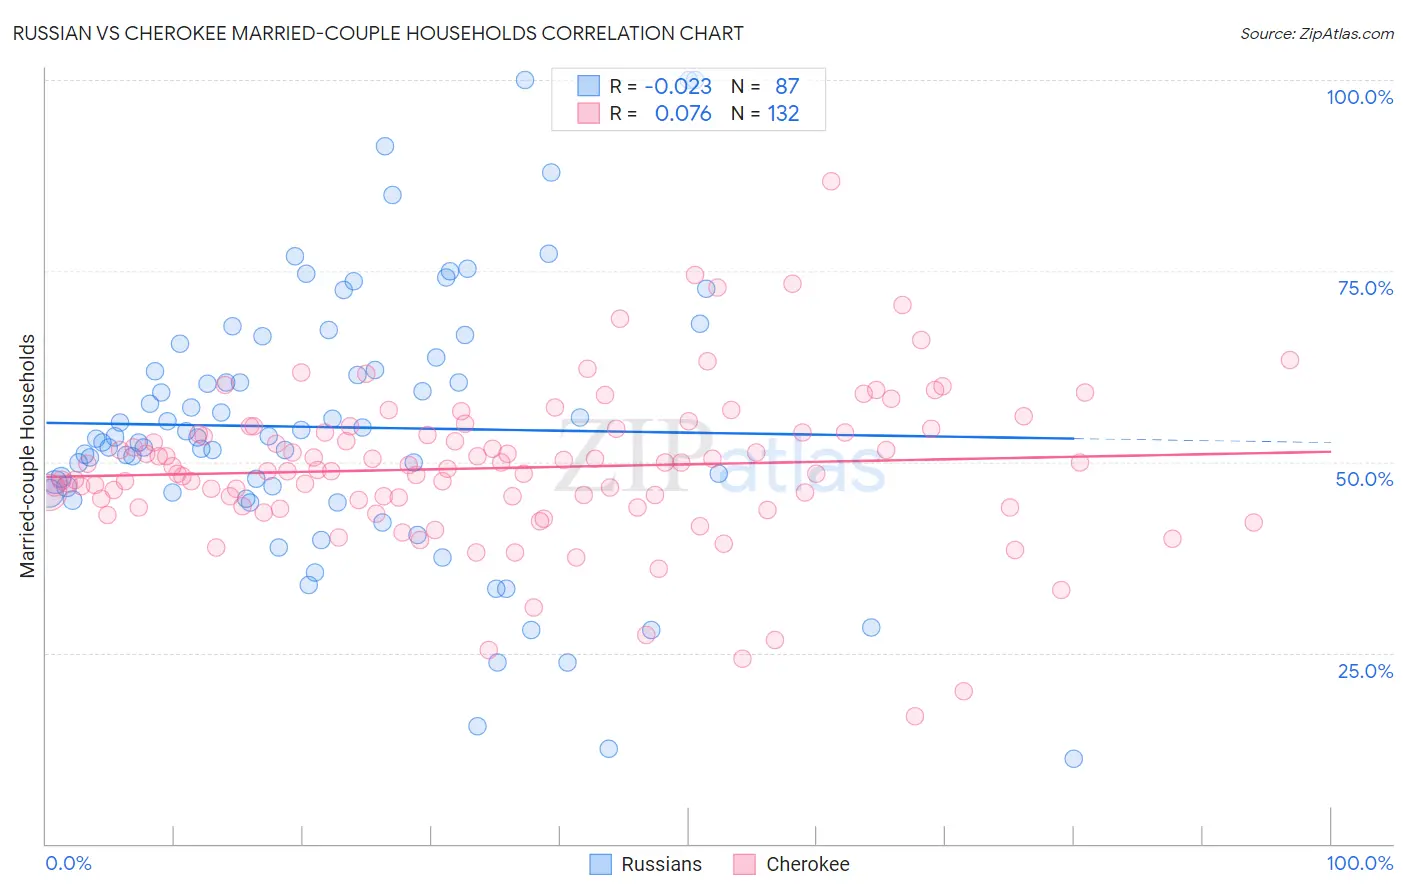
Russian vs Cherokee Married-couple Households Correlation Chart
The statistical analysis conducted on geographies consisting of 511,711,387 people shows no correlation between the proportion of Russians and percentage of married-couple family households in the United States with a correlation coefficient (R) of -0.023 and weighted average of 48.2%. Similarly, the statistical analysis conducted on geographies consisting of 493,370,237 people shows a slight positive correlation between the proportion of Cherokee and percentage of married-couple family households in the United States with a correlation coefficient (R) of 0.076 and weighted average of 46.7%, a difference of 3.1%.
Married-couple Households Correlation Summary
| Measurement | Russian | Cherokee |
| Minimum | 11.1% | 16.7% |
| Maximum | 100.0% | 86.8% |
| Range | 88.9% | 70.2% |
| Mean | 54.5% | 49.2% |
| Median | 53.3% | 49.0% |
| Interquartile 25% (IQ1) | 45.9% | 44.6% |
| Interquartile 75% (IQ3) | 63.7% | 53.9% |
| Interquartile Range (IQR) | 17.8% | 9.3% |
| Standard Deviation (Sample) | 17.9% | 10.1% |
| Standard Deviation (Population) | 17.8% | 10.1% |
Similar Demographics by Married-couple Households
Demographics Similar to Russians by Married-couple Households
In terms of married-couple households, the demographic groups most similar to Russians are Immigrants from Netherlands (48.2%, a difference of 0.020%), Egyptian (48.2%, a difference of 0.030%), Canadian (48.2%, a difference of 0.050%), Finnish (48.1%, a difference of 0.060%), and Immigrants from England (48.2%, a difference of 0.15%).
| Demographics | Rating | Rank | Married-couple Households |
| Immigrants | Singapore | 98.6 /100 | #73 | Exceptional 48.3% |
| Immigrants | Romania | 98.6 /100 | #74 | Exceptional 48.3% |
| Immigrants | England | 98.4 /100 | #75 | Exceptional 48.2% |
| Immigrants | Fiji | 98.4 /100 | #76 | Exceptional 48.2% |
| Canadians | 98.2 /100 | #77 | Exceptional 48.2% |
| Egyptians | 98.2 /100 | #78 | Exceptional 48.2% |
| Immigrants | Netherlands | 98.2 /100 | #79 | Exceptional 48.2% |
| Russians | 98.1 /100 | #80 | Exceptional 48.2% |
| Finns | 98.0 /100 | #81 | Exceptional 48.1% |
| Immigrants | Poland | 97.7 /100 | #82 | Exceptional 48.1% |
| Guamanians/Chamorros | 97.6 /100 | #83 | Exceptional 48.1% |
| Ukrainians | 97.6 /100 | #84 | Exceptional 48.1% |
| Immigrants | Israel | 97.4 /100 | #85 | Exceptional 48.0% |
| Belgians | 97.4 /100 | #86 | Exceptional 48.0% |
| Immigrants | Ireland | 97.3 /100 | #87 | Exceptional 48.0% |
Demographics Similar to Cherokee by Married-couple Households
In terms of married-couple households, the demographic groups most similar to Cherokee are Immigrants from Croatia (46.7%, a difference of 0.060%), Israeli (46.7%, a difference of 0.14%), Immigrants from Kazakhstan (46.8%, a difference of 0.18%), Immigrants from Southern Europe (46.8%, a difference of 0.18%), and Immigrants from Turkey (46.8%, a difference of 0.19%).
| Demographics | Rating | Rank | Married-couple Households |
| Osage | 73.2 /100 | #159 | Good 46.9% |
| Iraqis | 71.7 /100 | #160 | Good 46.9% |
| Delaware | 71.2 /100 | #161 | Good 46.8% |
| Colombians | 71.0 /100 | #162 | Good 46.8% |
| Immigrants | Turkey | 70.2 /100 | #163 | Good 46.8% |
| Immigrants | Kazakhstan | 70.0 /100 | #164 | Good 46.8% |
| Immigrants | Southern Europe | 69.9 /100 | #165 | Good 46.8% |
| Cherokee | 65.7 /100 | #166 | Good 46.7% |
| Immigrants | Croatia | 64.2 /100 | #167 | Good 46.7% |
| Israelis | 62.3 /100 | #168 | Good 46.7% |
| Spanish American Indians | 59.4 /100 | #169 | Average 46.6% |
| South Americans | 58.0 /100 | #170 | Average 46.6% |
| Immigrants | Chile | 55.7 /100 | #171 | Average 46.5% |
| Immigrants | Australia | 54.6 /100 | #172 | Average 46.5% |
| Immigrants | Norway | 52.0 /100 | #173 | Average 46.5% |