Bolivian vs Slovak Married-couple Households
COMPARE
Bolivian
Slovak
Married-couple Households
Married-couple Households Comparison
Bolivians
Slovaks
49.2%
MARRIED-COUPLE HOUSEHOLDS
99.8/ 100
METRIC RATING
30th/ 347
METRIC RANK
47.6%
MARRIED-COUPLE HOUSEHOLDS
92.9/ 100
METRIC RATING
115th/ 347
METRIC RANK
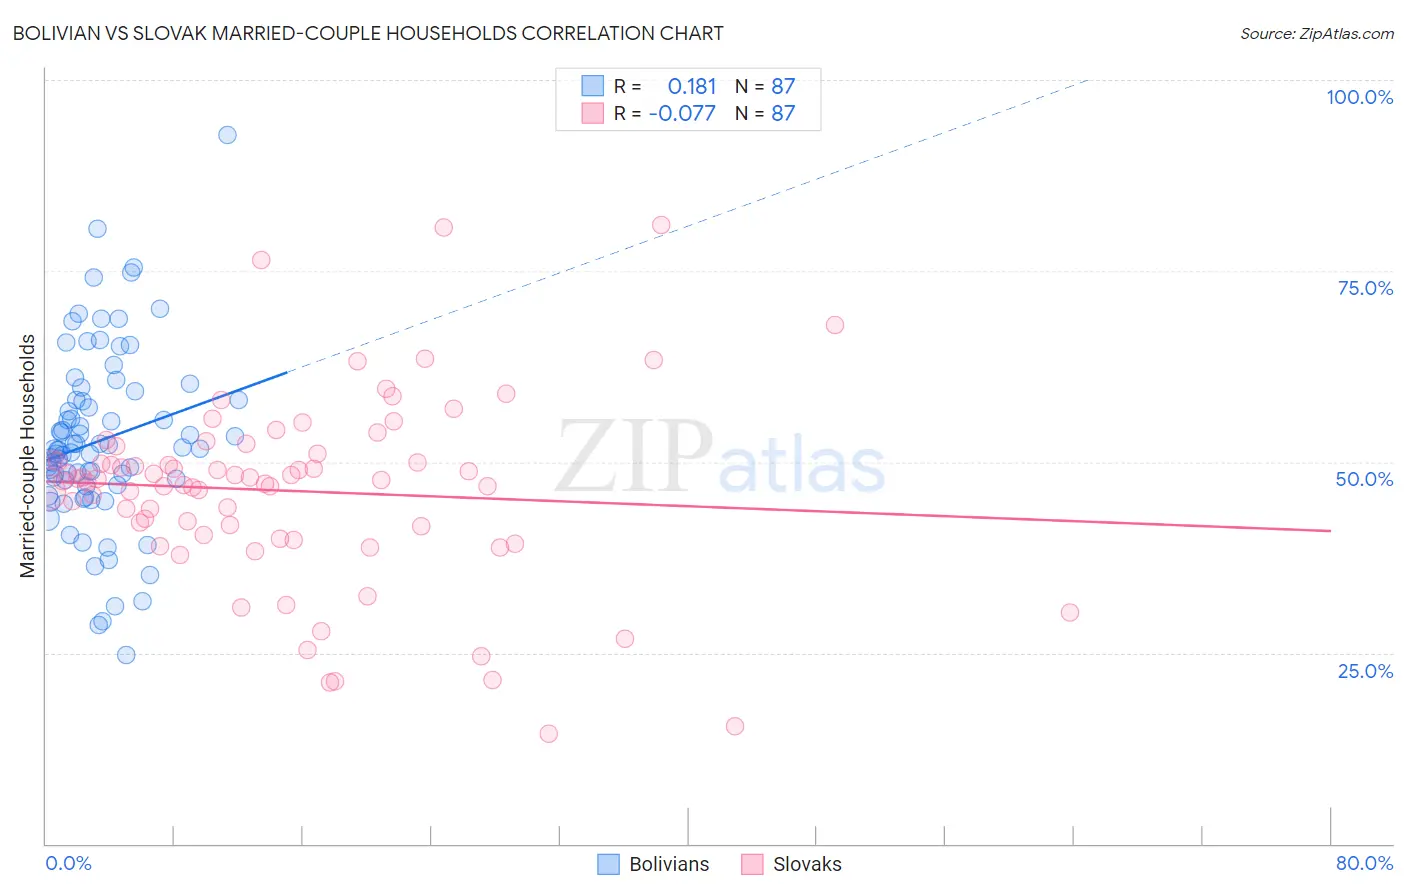
Bolivian vs Slovak Married-couple Households Correlation Chart
The statistical analysis conducted on geographies consisting of 184,628,084 people shows a poor positive correlation between the proportion of Bolivians and percentage of married-couple family households in the United States with a correlation coefficient (R) of 0.181 and weighted average of 49.2%. Similarly, the statistical analysis conducted on geographies consisting of 397,658,026 people shows a slight negative correlation between the proportion of Slovaks and percentage of married-couple family households in the United States with a correlation coefficient (R) of -0.077 and weighted average of 47.6%, a difference of 3.3%.
Married-couple Households Correlation Summary
| Measurement | Bolivian | Slovak |
| Minimum | 24.7% | 14.5% |
| Maximum | 92.8% | 81.0% |
| Range | 68.0% | 66.6% |
| Mean | 52.8% | 46.2% |
| Median | 51.7% | 47.7% |
| Interquartile 25% (IQ1) | 47.0% | 40.4% |
| Interquartile 75% (IQ3) | 58.2% | 51.1% |
| Interquartile Range (IQR) | 11.1% | 10.7% |
| Standard Deviation (Sample) | 11.7% | 12.3% |
| Standard Deviation (Population) | 11.6% | 12.3% |
Similar Demographics by Married-couple Households
Demographics Similar to Bolivians by Married-couple Households
In terms of married-couple households, the demographic groups most similar to Bolivians are German (49.2%, a difference of 0.020%), Maltese (49.2%, a difference of 0.020%), Native Hawaiian (49.1%, a difference of 0.11%), Hungarian (49.1%, a difference of 0.17%), and Immigrants from Asia (49.1%, a difference of 0.20%).
| Demographics | Rating | Rank | Married-couple Households |
| Dutch | 99.9 /100 | #23 | Exceptional 49.5% |
| Czechs | 99.9 /100 | #24 | Exceptional 49.4% |
| Immigrants | Philippines | 99.9 /100 | #25 | Exceptional 49.3% |
| Immigrants | Scotland | 99.8 /100 | #26 | Exceptional 49.3% |
| Bhutanese | 99.8 /100 | #27 | Exceptional 49.3% |
| Germans | 99.8 /100 | #28 | Exceptional 49.2% |
| Maltese | 99.8 /100 | #29 | Exceptional 49.2% |
| Bolivians | 99.8 /100 | #30 | Exceptional 49.2% |
| Native Hawaiians | 99.8 /100 | #31 | Exceptional 49.1% |
| Hungarians | 99.8 /100 | #32 | Exceptional 49.1% |
| Immigrants | Asia | 99.7 /100 | #33 | Exceptional 49.1% |
| Italians | 99.7 /100 | #34 | Exceptional 49.0% |
| Scottish | 99.7 /100 | #35 | Exceptional 49.0% |
| Iranians | 99.7 /100 | #36 | Exceptional 49.0% |
| Sri Lankans | 99.7 /100 | #37 | Exceptional 49.0% |
Demographics Similar to Slovaks by Married-couple Households
In terms of married-couple households, the demographic groups most similar to Slovaks are Argentinean (47.5%, a difference of 0.050%), French Canadian (47.5%, a difference of 0.060%), Immigrants from Germany (47.5%, a difference of 0.070%), Chilean (47.5%, a difference of 0.10%), and Immigrants from Europe (47.6%, a difference of 0.12%).
| Demographics | Rating | Rank | Married-couple Households |
| Immigrants | Japan | 94.4 /100 | #108 | Exceptional 47.7% |
| Immigrants | Jordan | 94.1 /100 | #109 | Exceptional 47.7% |
| Macedonians | 93.9 /100 | #110 | Exceptional 47.6% |
| Syrians | 93.9 /100 | #111 | Exceptional 47.6% |
| Peruvians | 93.8 /100 | #112 | Exceptional 47.6% |
| Venezuelans | 93.8 /100 | #113 | Exceptional 47.6% |
| Immigrants | Europe | 93.7 /100 | #114 | Exceptional 47.6% |
| Slovaks | 92.9 /100 | #115 | Exceptional 47.6% |
| Argentineans | 92.5 /100 | #116 | Exceptional 47.5% |
| French Canadians | 92.4 /100 | #117 | Exceptional 47.5% |
| Immigrants | Germany | 92.4 /100 | #118 | Exceptional 47.5% |
| Chileans | 92.2 /100 | #119 | Exceptional 47.5% |
| Puget Sound Salish | 90.5 /100 | #120 | Exceptional 47.4% |
| Immigrants | Eastern Europe | 90.3 /100 | #121 | Exceptional 47.4% |
| Okinawans | 90.1 /100 | #122 | Exceptional 47.4% |