Bolivian vs White/Caucasian Married-couple Households
COMPARE
Bolivian
White/Caucasian
Married-couple Households
Married-couple Households Comparison
Bolivians
Whites/Caucasians
49.2%
MARRIED-COUPLE HOUSEHOLDS
99.8/ 100
METRIC RATING
30th/ 347
METRIC RANK
48.6%
MARRIED-COUPLE HOUSEHOLDS
99.3/ 100
METRIC RATING
53rd/ 347
METRIC RANK
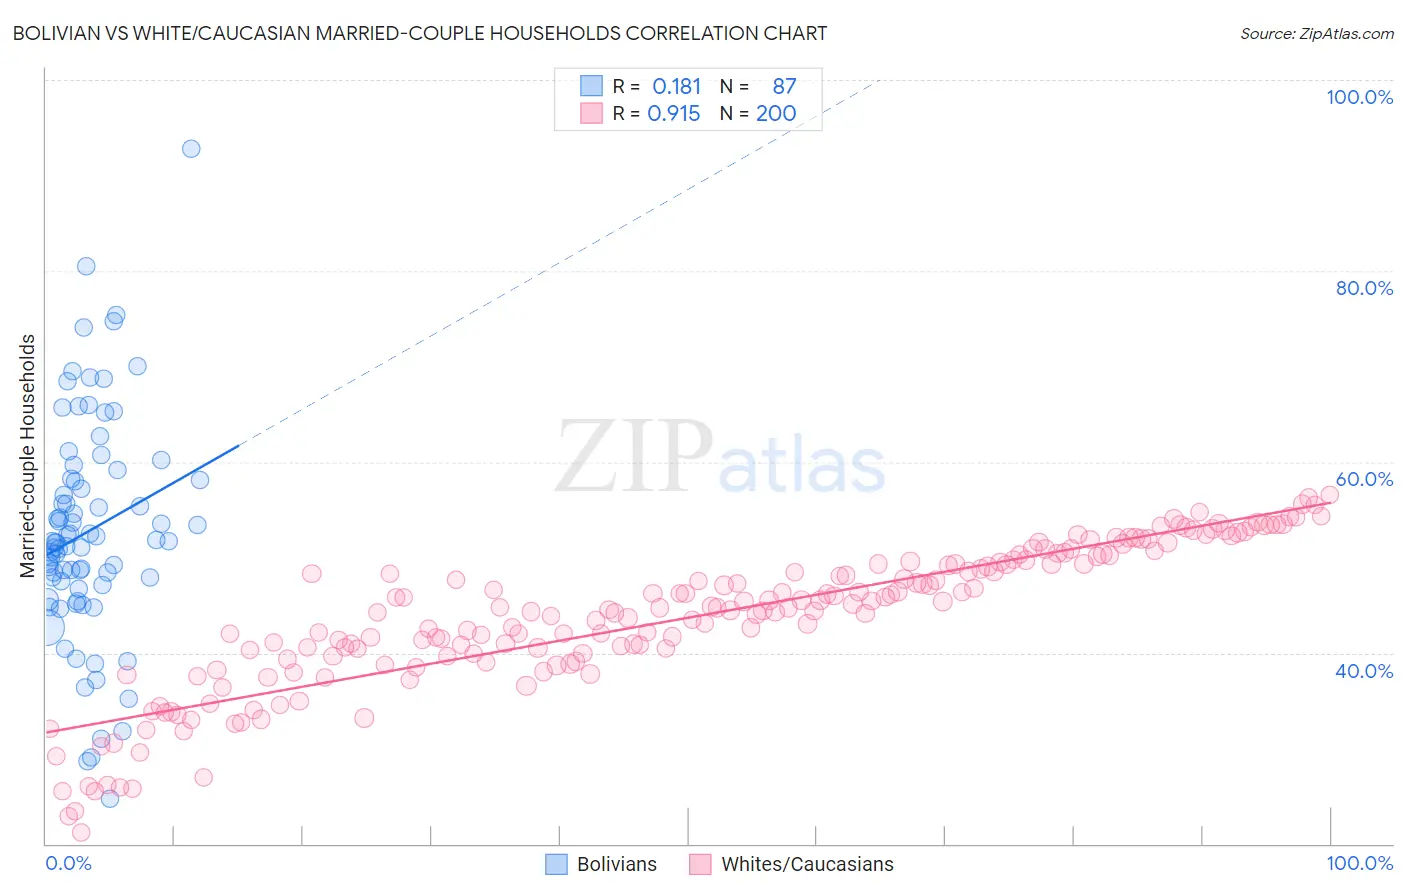
Bolivian vs White/Caucasian Married-couple Households Correlation Chart
The statistical analysis conducted on geographies consisting of 184,628,084 people shows a poor positive correlation between the proportion of Bolivians and percentage of married-couple family households in the United States with a correlation coefficient (R) of 0.181 and weighted average of 49.2%. Similarly, the statistical analysis conducted on geographies consisting of 584,446,741 people shows a near-perfect positive correlation between the proportion of Whites/Caucasians and percentage of married-couple family households in the United States with a correlation coefficient (R) of 0.915 and weighted average of 48.6%, a difference of 1.1%.
Married-couple Households Correlation Summary
| Measurement | Bolivian | White/Caucasian |
| Minimum | 24.7% | 21.1% |
| Maximum | 92.8% | 56.5% |
| Range | 68.0% | 35.4% |
| Mean | 52.8% | 43.7% |
| Median | 51.7% | 44.7% |
| Interquartile 25% (IQ1) | 47.0% | 39.7% |
| Interquartile 75% (IQ3) | 58.2% | 49.4% |
| Interquartile Range (IQR) | 11.1% | 9.8% |
| Standard Deviation (Sample) | 11.7% | 7.6% |
| Standard Deviation (Population) | 11.6% | 7.6% |
Similar Demographics by Married-couple Households
Demographics Similar to Bolivians by Married-couple Households
In terms of married-couple households, the demographic groups most similar to Bolivians are German (49.2%, a difference of 0.020%), Maltese (49.2%, a difference of 0.020%), Native Hawaiian (49.1%, a difference of 0.11%), Hungarian (49.1%, a difference of 0.17%), and Immigrants from Asia (49.1%, a difference of 0.20%).
| Demographics | Rating | Rank | Married-couple Households |
| Dutch | 99.9 /100 | #23 | Exceptional 49.5% |
| Czechs | 99.9 /100 | #24 | Exceptional 49.4% |
| Immigrants | Philippines | 99.9 /100 | #25 | Exceptional 49.3% |
| Immigrants | Scotland | 99.8 /100 | #26 | Exceptional 49.3% |
| Bhutanese | 99.8 /100 | #27 | Exceptional 49.3% |
| Germans | 99.8 /100 | #28 | Exceptional 49.2% |
| Maltese | 99.8 /100 | #29 | Exceptional 49.2% |
| Bolivians | 99.8 /100 | #30 | Exceptional 49.2% |
| Native Hawaiians | 99.8 /100 | #31 | Exceptional 49.1% |
| Hungarians | 99.8 /100 | #32 | Exceptional 49.1% |
| Immigrants | Asia | 99.7 /100 | #33 | Exceptional 49.1% |
| Italians | 99.7 /100 | #34 | Exceptional 49.0% |
| Scottish | 99.7 /100 | #35 | Exceptional 49.0% |
| Iranians | 99.7 /100 | #36 | Exceptional 49.0% |
| Sri Lankans | 99.7 /100 | #37 | Exceptional 49.0% |
Demographics Similar to Whites/Caucasians by Married-couple Households
In terms of married-couple households, the demographic groups most similar to Whites/Caucasians are Immigrants from Lithuania (48.6%, a difference of 0.010%), Austrian (48.6%, a difference of 0.010%), Immigrants from Northern Europe (48.6%, a difference of 0.010%), Irish (48.6%, a difference of 0.050%), and Eastern European (48.6%, a difference of 0.090%).
| Demographics | Rating | Rank | Married-couple Households |
| Tsimshian | 99.5 /100 | #46 | Exceptional 48.7% |
| British | 99.5 /100 | #47 | Exceptional 48.7% |
| Indians (Asian) | 99.4 /100 | #48 | Exceptional 48.7% |
| Immigrants | Sri Lanka | 99.4 /100 | #49 | Exceptional 48.7% |
| Samoans | 99.4 /100 | #50 | Exceptional 48.7% |
| Eastern Europeans | 99.3 /100 | #51 | Exceptional 48.6% |
| Irish | 99.3 /100 | #52 | Exceptional 48.6% |
| Whites/Caucasians | 99.3 /100 | #53 | Exceptional 48.6% |
| Immigrants | Lithuania | 99.3 /100 | #54 | Exceptional 48.6% |
| Austrians | 99.3 /100 | #55 | Exceptional 48.6% |
| Immigrants | Northern Europe | 99.3 /100 | #56 | Exceptional 48.6% |
| Poles | 99.2 /100 | #57 | Exceptional 48.5% |
| Immigrants | Indonesia | 99.2 /100 | #58 | Exceptional 48.5% |
| Czechoslovakians | 99.2 /100 | #59 | Exceptional 48.5% |
| Croatians | 99.1 /100 | #60 | Exceptional 48.5% |