Northern European vs Cherokee Married-couple Households
COMPARE
Northern European
Cherokee
Married-couple Households
Married-couple Households Comparison
Northern Europeans
Cherokee
48.4%
MARRIED-COUPLE HOUSEHOLDS
99.0/ 100
METRIC RATING
64th/ 347
METRIC RANK
46.7%
MARRIED-COUPLE HOUSEHOLDS
65.7/ 100
METRIC RATING
166th/ 347
METRIC RANK
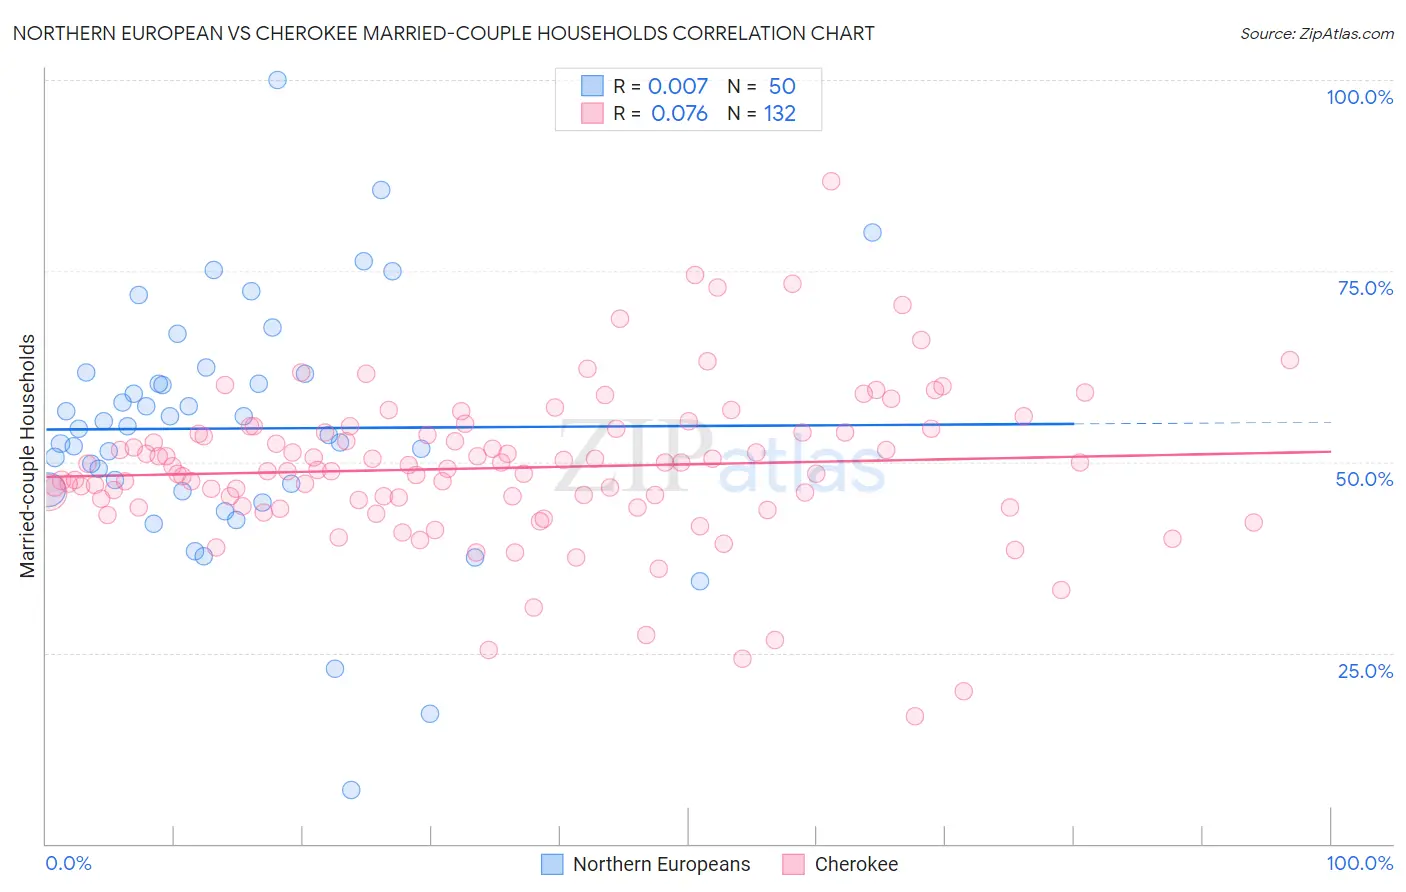
Northern European vs Cherokee Married-couple Households Correlation Chart
The statistical analysis conducted on geographies consisting of 405,935,779 people shows no correlation between the proportion of Northern Europeans and percentage of married-couple family households in the United States with a correlation coefficient (R) of 0.007 and weighted average of 48.4%. Similarly, the statistical analysis conducted on geographies consisting of 493,370,237 people shows a slight positive correlation between the proportion of Cherokee and percentage of married-couple family households in the United States with a correlation coefficient (R) of 0.076 and weighted average of 46.7%, a difference of 3.7%.
Married-couple Households Correlation Summary
| Measurement | Northern European | Cherokee |
| Minimum | 7.1% | 16.7% |
| Maximum | 100.0% | 86.8% |
| Range | 92.9% | 70.2% |
| Mean | 54.4% | 49.2% |
| Median | 54.5% | 49.0% |
| Interquartile 25% (IQ1) | 46.4% | 44.6% |
| Interquartile 75% (IQ3) | 61.6% | 53.9% |
| Interquartile Range (IQR) | 15.2% | 9.3% |
| Standard Deviation (Sample) | 16.3% | 10.1% |
| Standard Deviation (Population) | 16.1% | 10.1% |
Similar Demographics by Married-couple Households
Demographics Similar to Northern Europeans by Married-couple Households
In terms of married-couple households, the demographic groups most similar to Northern Europeans are Basque (48.4%, a difference of 0.010%), Immigrants from Canada (48.4%, a difference of 0.020%), Jordanian (48.4%, a difference of 0.040%), Romanian (48.4%, a difference of 0.050%), and Immigrants from South Eastern Asia (48.4%, a difference of 0.060%).
| Demographics | Rating | Rank | Married-couple Households |
| Poles | 99.2 /100 | #57 | Exceptional 48.5% |
| Immigrants | Indonesia | 99.2 /100 | #58 | Exceptional 48.5% |
| Czechoslovakians | 99.2 /100 | #59 | Exceptional 48.5% |
| Croatians | 99.1 /100 | #60 | Exceptional 48.5% |
| Bulgarians | 99.1 /100 | #61 | Exceptional 48.5% |
| Luxembourgers | 99.1 /100 | #62 | Exceptional 48.5% |
| Basques | 99.0 /100 | #63 | Exceptional 48.4% |
| Northern Europeans | 99.0 /100 | #64 | Exceptional 48.4% |
| Immigrants | Canada | 99.0 /100 | #65 | Exceptional 48.4% |
| Jordanians | 98.9 /100 | #66 | Exceptional 48.4% |
| Romanians | 98.9 /100 | #67 | Exceptional 48.4% |
| Immigrants | South Eastern Asia | 98.9 /100 | #68 | Exceptional 48.4% |
| Immigrants | China | 98.9 /100 | #69 | Exceptional 48.4% |
| Immigrants | North America | 98.9 /100 | #70 | Exceptional 48.4% |
| Laotians | 98.8 /100 | #71 | Exceptional 48.4% |
Demographics Similar to Cherokee by Married-couple Households
In terms of married-couple households, the demographic groups most similar to Cherokee are Immigrants from Croatia (46.7%, a difference of 0.060%), Israeli (46.7%, a difference of 0.14%), Immigrants from Kazakhstan (46.8%, a difference of 0.18%), Immigrants from Southern Europe (46.8%, a difference of 0.18%), and Immigrants from Turkey (46.8%, a difference of 0.19%).
| Demographics | Rating | Rank | Married-couple Households |
| Osage | 73.2 /100 | #159 | Good 46.9% |
| Iraqis | 71.7 /100 | #160 | Good 46.9% |
| Delaware | 71.2 /100 | #161 | Good 46.8% |
| Colombians | 71.0 /100 | #162 | Good 46.8% |
| Immigrants | Turkey | 70.2 /100 | #163 | Good 46.8% |
| Immigrants | Kazakhstan | 70.0 /100 | #164 | Good 46.8% |
| Immigrants | Southern Europe | 69.9 /100 | #165 | Good 46.8% |
| Cherokee | 65.7 /100 | #166 | Good 46.7% |
| Immigrants | Croatia | 64.2 /100 | #167 | Good 46.7% |
| Israelis | 62.3 /100 | #168 | Good 46.7% |
| Spanish American Indians | 59.4 /100 | #169 | Average 46.6% |
| South Americans | 58.0 /100 | #170 | Average 46.6% |
| Immigrants | Chile | 55.7 /100 | #171 | Average 46.5% |
| Immigrants | Australia | 54.6 /100 | #172 | Average 46.5% |
| Immigrants | Norway | 52.0 /100 | #173 | Average 46.5% |