West Indian vs Immigrants from Vietnam Births to Unmarried Women
COMPARE
West Indian
Immigrants from Vietnam
Births to Unmarried Women
Births to Unmarried Women Comparison
West Indians
Immigrants from Vietnam
37.3%
BIRTHS TO UNMARRIED WOMEN
0.1/ 100
METRIC RATING
279th/ 347
METRIC RANK
29.3%
BIRTHS TO UNMARRIED WOMEN
96.1/ 100
METRIC RATING
95th/ 347
METRIC RANK
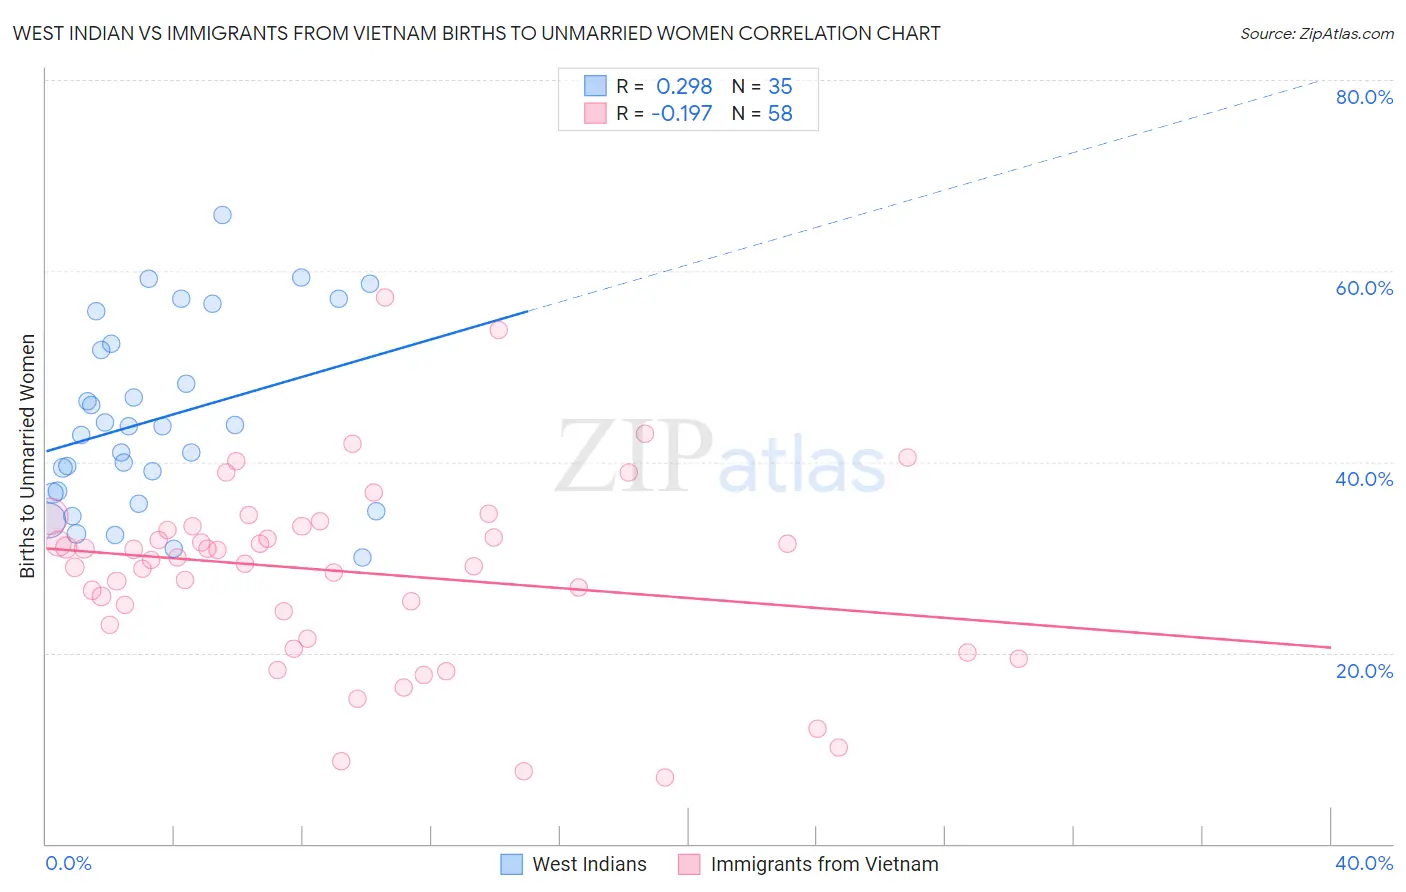
West Indian vs Immigrants from Vietnam Births to Unmarried Women Correlation Chart
The statistical analysis conducted on geographies consisting of 244,812,530 people shows a weak positive correlation between the proportion of West Indians and percentage of births to unmarried women in the United States with a correlation coefficient (R) of 0.298 and weighted average of 37.3%. Similarly, the statistical analysis conducted on geographies consisting of 380,517,286 people shows a poor negative correlation between the proportion of Immigrants from Vietnam and percentage of births to unmarried women in the United States with a correlation coefficient (R) of -0.197 and weighted average of 29.3%, a difference of 27.3%.
Births to Unmarried Women Correlation Summary
| Measurement | West Indian | Immigrants from Vietnam |
| Minimum | 30.0% | 6.9% |
| Maximum | 65.8% | 57.3% |
| Range | 35.8% | 50.4% |
| Mean | 44.5% | 28.5% |
| Median | 43.7% | 29.9% |
| Interquartile 25% (IQ1) | 36.7% | 22.9% |
| Interquartile 75% (IQ3) | 52.4% | 33.2% |
| Interquartile Range (IQR) | 15.7% | 10.3% |
| Standard Deviation (Sample) | 9.6% | 9.9% |
| Standard Deviation (Population) | 9.5% | 9.9% |
Similar Demographics by Births to Unmarried Women
Demographics Similar to West Indians by Births to Unmarried Women
In terms of births to unmarried women, the demographic groups most similar to West Indians are Immigrants from St. Vincent and the Grenadines (37.3%, a difference of 0.12%), Immigrants from Belize (37.3%, a difference of 0.13%), Liberian (37.4%, a difference of 0.30%), Immigrants from Latin America (37.1%, a difference of 0.33%), and Spanish American Indian (37.4%, a difference of 0.38%).
| Demographics | Rating | Rank | Births to Unmarried Women |
| Choctaw | 0.1 /100 | #272 | Tragic 36.9% |
| Mexicans | 0.1 /100 | #273 | Tragic 36.9% |
| Cree | 0.1 /100 | #274 | Tragic 37.0% |
| Barbadians | 0.1 /100 | #275 | Tragic 37.0% |
| Belizeans | 0.1 /100 | #276 | Tragic 37.0% |
| Guatemalans | 0.1 /100 | #277 | Tragic 37.1% |
| Immigrants | Latin America | 0.1 /100 | #278 | Tragic 37.1% |
| West Indians | 0.1 /100 | #279 | Tragic 37.3% |
| Immigrants | St. Vincent and the Grenadines | 0.1 /100 | #280 | Tragic 37.3% |
| Immigrants | Belize | 0.1 /100 | #281 | Tragic 37.3% |
| Liberians | 0.0 /100 | #282 | Tragic 37.4% |
| Spanish American Indians | 0.0 /100 | #283 | Tragic 37.4% |
| Immigrants | Central America | 0.0 /100 | #284 | Tragic 37.4% |
| Immigrants | Mexico | 0.0 /100 | #285 | Tragic 37.5% |
| Immigrants | Guatemala | 0.0 /100 | #286 | Tragic 37.5% |
Demographics Similar to Immigrants from Vietnam by Births to Unmarried Women
In terms of births to unmarried women, the demographic groups most similar to Immigrants from Vietnam are Ukrainian (29.2%, a difference of 0.13%), Norwegian (29.3%, a difference of 0.23%), Estonian (29.2%, a difference of 0.26%), Immigrants from South Africa (29.3%, a difference of 0.27%), and Arab (29.2%, a difference of 0.30%).
| Demographics | Rating | Rank | Births to Unmarried Women |
| Immigrants | France | 97.3 /100 | #88 | Exceptional 29.0% |
| Immigrants | Saudi Arabia | 97.0 /100 | #89 | Exceptional 29.1% |
| Immigrants | Latvia | 96.8 /100 | #90 | Exceptional 29.1% |
| Immigrants | Fiji | 96.6 /100 | #91 | Exceptional 29.2% |
| Arabs | 96.5 /100 | #92 | Exceptional 29.2% |
| Estonians | 96.5 /100 | #93 | Exceptional 29.2% |
| Ukrainians | 96.3 /100 | #94 | Exceptional 29.2% |
| Immigrants | Vietnam | 96.1 /100 | #95 | Exceptional 29.3% |
| Norwegians | 95.8 /100 | #96 | Exceptional 29.3% |
| Immigrants | South Africa | 95.7 /100 | #97 | Exceptional 29.3% |
| Immigrants | Syria | 95.7 /100 | #98 | Exceptional 29.4% |
| Immigrants | Denmark | 95.3 /100 | #99 | Exceptional 29.4% |
| Luxembourgers | 95.2 /100 | #100 | Exceptional 29.4% |
| Immigrants | Northern Africa | 94.7 /100 | #101 | Exceptional 29.5% |
| Australians | 94.6 /100 | #102 | Exceptional 29.5% |