Blackfeet vs Liberian Married-couple Households
COMPARE
Blackfeet
Liberian
Married-couple Households
Married-couple Households Comparison
Blackfeet
Liberians
43.8%
MARRIED-COUPLE HOUSEHOLDS
0.2/ 100
METRIC RATING
257th/ 347
METRIC RANK
40.7%
MARRIED-COUPLE HOUSEHOLDS
0.0/ 100
METRIC RATING
318th/ 347
METRIC RANK
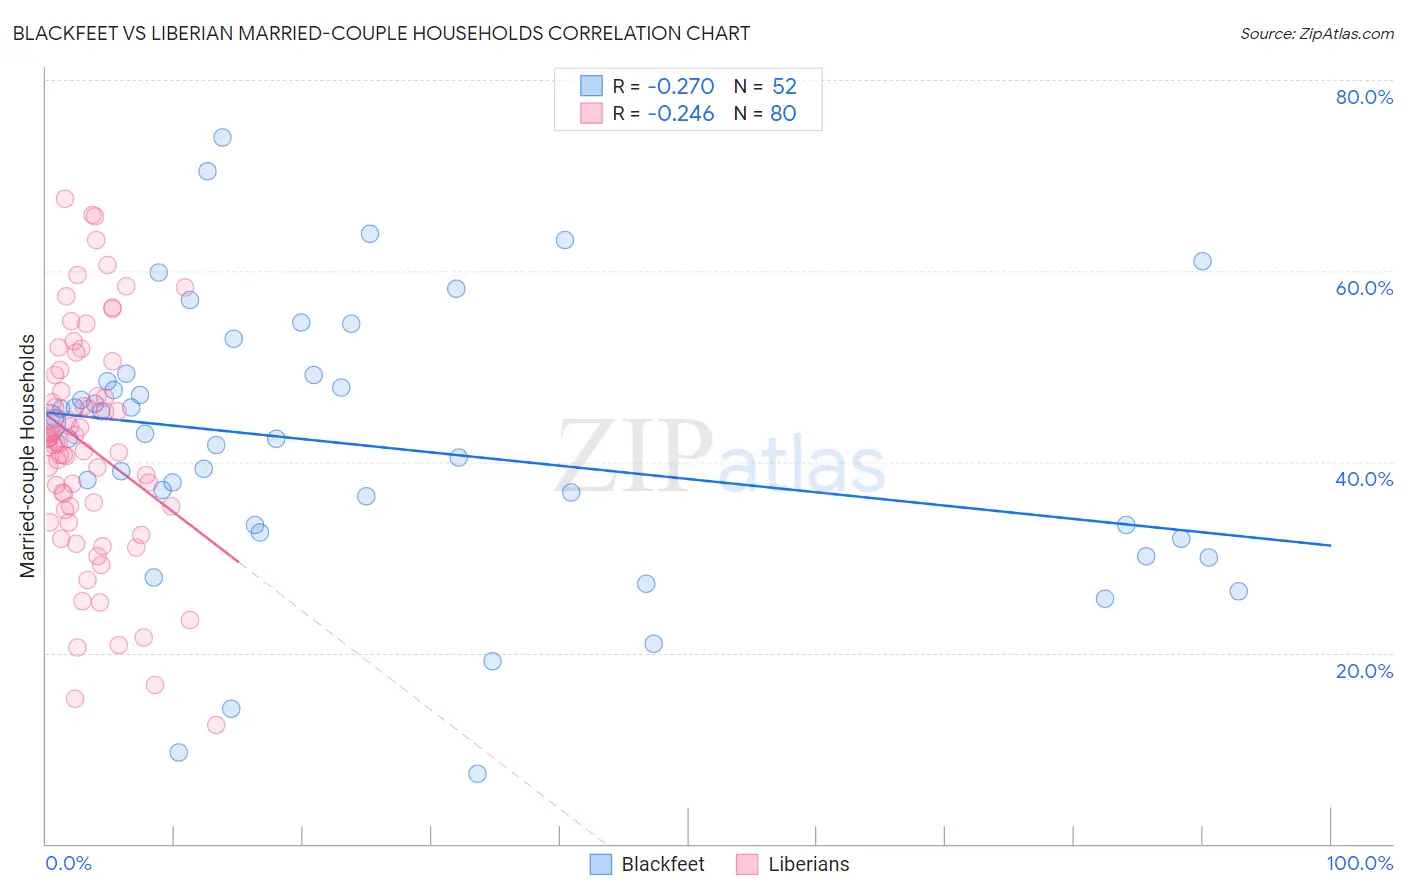
Blackfeet vs Liberian Married-couple Households Correlation Chart
The statistical analysis conducted on geographies consisting of 309,469,352 people shows a weak negative correlation between the proportion of Blackfeet and percentage of married-couple family households in the United States with a correlation coefficient (R) of -0.270 and weighted average of 43.8%. Similarly, the statistical analysis conducted on geographies consisting of 118,032,066 people shows a weak negative correlation between the proportion of Liberians and percentage of married-couple family households in the United States with a correlation coefficient (R) of -0.246 and weighted average of 40.7%, a difference of 7.7%.
Married-couple Households Correlation Summary
| Measurement | Blackfeet | Liberian |
| Minimum | 7.3% | 12.5% |
| Maximum | 74.0% | 67.6% |
| Range | 66.7% | 55.1% |
| Mean | 41.7% | 41.7% |
| Median | 42.7% | 42.0% |
| Interquartile 25% (IQ1) | 33.0% | 35.1% |
| Interquartile 75% (IQ3) | 48.8% | 48.2% |
| Interquartile Range (IQR) | 15.8% | 13.1% |
| Standard Deviation (Sample) | 14.3% | 11.9% |
| Standard Deviation (Population) | 14.1% | 11.8% |
Similar Demographics by Married-couple Households
Demographics Similar to Blackfeet by Married-couple Households
In terms of married-couple households, the demographic groups most similar to Blackfeet are Central American Indian (43.8%, a difference of 0.040%), Iroquois (43.7%, a difference of 0.070%), Immigrants from Cameroon (43.7%, a difference of 0.15%), Ugandan (43.8%, a difference of 0.16%), and Alaskan Athabascan (43.6%, a difference of 0.28%).
| Demographics | Rating | Rank | Married-couple Households |
| French American Indians | 0.4 /100 | #250 | Tragic 44.1% |
| German Russians | 0.4 /100 | #251 | Tragic 44.0% |
| Seminole | 0.4 /100 | #252 | Tragic 44.0% |
| Central Americans | 0.3 /100 | #253 | Tragic 43.9% |
| Apache | 0.3 /100 | #254 | Tragic 43.9% |
| Shoshone | 0.3 /100 | #255 | Tragic 43.9% |
| Ugandans | 0.3 /100 | #256 | Tragic 43.8% |
| Blackfeet | 0.2 /100 | #257 | Tragic 43.8% |
| Central American Indians | 0.2 /100 | #258 | Tragic 43.8% |
| Iroquois | 0.2 /100 | #259 | Tragic 43.7% |
| Immigrants | Cameroon | 0.2 /100 | #260 | Tragic 43.7% |
| Alaskan Athabascans | 0.2 /100 | #261 | Tragic 43.6% |
| Vietnamese | 0.2 /100 | #262 | Tragic 43.6% |
| Cree | 0.1 /100 | #263 | Tragic 43.6% |
| Bangladeshis | 0.1 /100 | #264 | Tragic 43.5% |
Demographics Similar to Liberians by Married-couple Households
In terms of married-couple households, the demographic groups most similar to Liberians are Immigrants from Jamaica (40.7%, a difference of 0.010%), Immigrants from Caribbean (40.8%, a difference of 0.30%), Bahamian (40.5%, a difference of 0.35%), Trinidadian and Tobagonian (40.9%, a difference of 0.48%), and Jamaican (40.9%, a difference of 0.56%).
| Demographics | Rating | Rank | Married-couple Households |
| Colville | 0.0 /100 | #311 | Tragic 41.0% |
| Africans | 0.0 /100 | #312 | Tragic 40.9% |
| Immigrants | Haiti | 0.0 /100 | #313 | Tragic 40.9% |
| Jamaicans | 0.0 /100 | #314 | Tragic 40.9% |
| Trinidadians and Tobagonians | 0.0 /100 | #315 | Tragic 40.9% |
| Immigrants | Caribbean | 0.0 /100 | #316 | Tragic 40.8% |
| Immigrants | Jamaica | 0.0 /100 | #317 | Tragic 40.7% |
| Liberians | 0.0 /100 | #318 | Tragic 40.7% |
| Bahamians | 0.0 /100 | #319 | Tragic 40.5% |
| West Indians | 0.0 /100 | #320 | Tragic 40.3% |
| Immigrants | Liberia | 0.0 /100 | #321 | Tragic 40.3% |
| Immigrants | Zaire | 0.0 /100 | #322 | Tragic 40.1% |
| Puerto Ricans | 0.0 /100 | #323 | Tragic 40.1% |
| Navajo | 0.0 /100 | #324 | Tragic 40.1% |
| Pueblo | 0.0 /100 | #325 | Tragic 40.0% |