Blackfeet vs Somali Married-couple Households
COMPARE
Blackfeet
Somali
Married-couple Households
Married-couple Households Comparison
Blackfeet
Somalis
43.8%
MARRIED-COUPLE HOUSEHOLDS
0.2/ 100
METRIC RATING
257th/ 347
METRIC RANK
39.0%
MARRIED-COUPLE HOUSEHOLDS
0.0/ 100
METRIC RATING
332nd/ 347
METRIC RANK
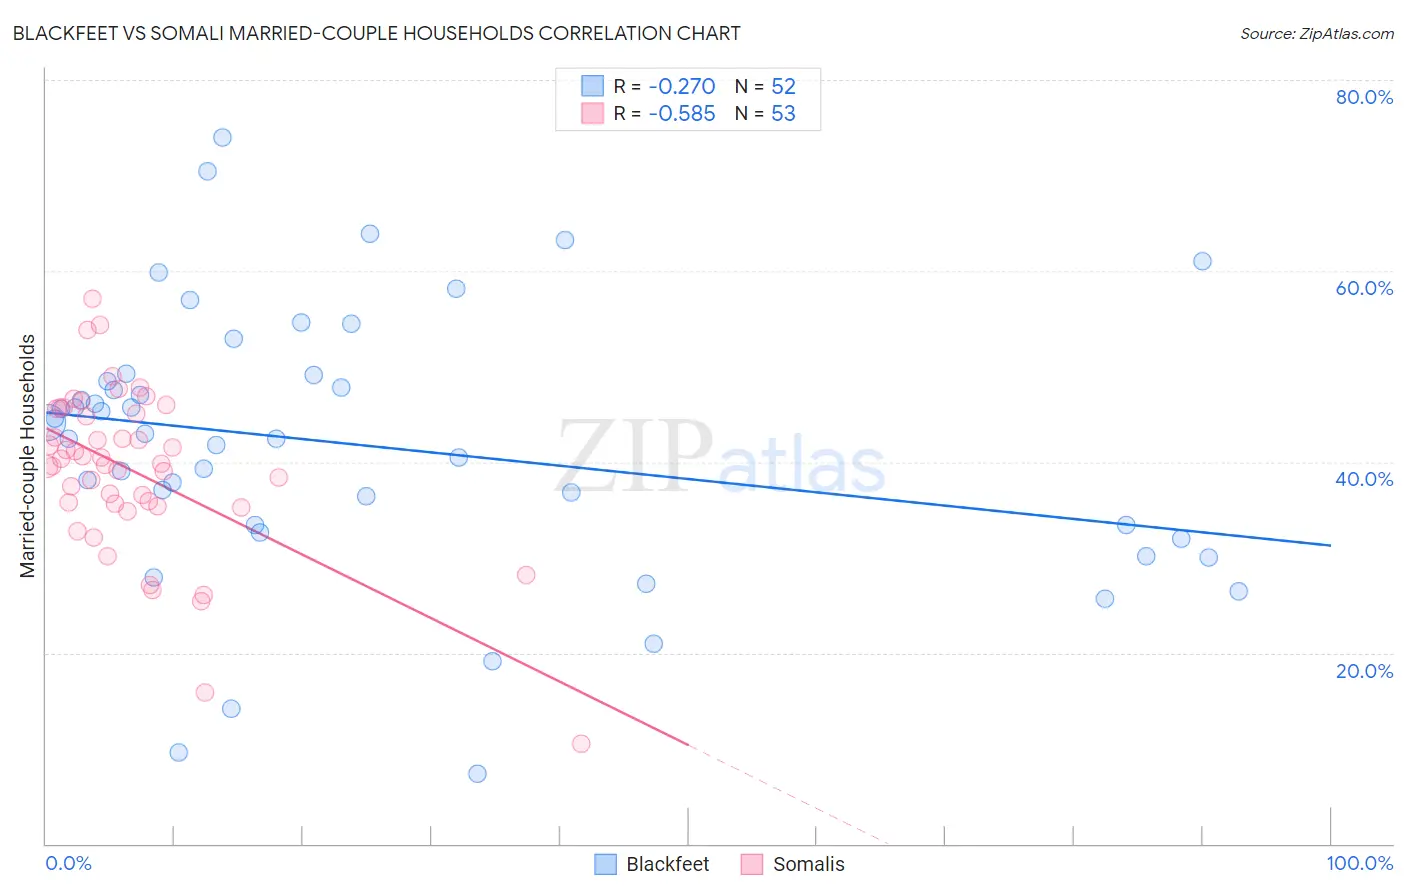
Blackfeet vs Somali Married-couple Households Correlation Chart
The statistical analysis conducted on geographies consisting of 309,469,352 people shows a weak negative correlation between the proportion of Blackfeet and percentage of married-couple family households in the United States with a correlation coefficient (R) of -0.270 and weighted average of 43.8%. Similarly, the statistical analysis conducted on geographies consisting of 99,290,778 people shows a substantial negative correlation between the proportion of Somalis and percentage of married-couple family households in the United States with a correlation coefficient (R) of -0.585 and weighted average of 39.0%, a difference of 12.2%.
Married-couple Households Correlation Summary
| Measurement | Blackfeet | Somali |
| Minimum | 7.3% | 10.5% |
| Maximum | 74.0% | 57.0% |
| Range | 66.7% | 46.6% |
| Mean | 41.7% | 39.1% |
| Median | 42.7% | 39.8% |
| Interquartile 25% (IQ1) | 33.0% | 35.5% |
| Interquartile 75% (IQ3) | 48.8% | 45.3% |
| Interquartile Range (IQR) | 15.8% | 9.8% |
| Standard Deviation (Sample) | 14.3% | 8.7% |
| Standard Deviation (Population) | 14.1% | 8.6% |
Similar Demographics by Married-couple Households
Demographics Similar to Blackfeet by Married-couple Households
In terms of married-couple households, the demographic groups most similar to Blackfeet are Central American Indian (43.8%, a difference of 0.040%), Iroquois (43.7%, a difference of 0.070%), Immigrants from Cameroon (43.7%, a difference of 0.15%), Ugandan (43.8%, a difference of 0.16%), and Alaskan Athabascan (43.6%, a difference of 0.28%).
| Demographics | Rating | Rank | Married-couple Households |
| French American Indians | 0.4 /100 | #250 | Tragic 44.1% |
| German Russians | 0.4 /100 | #251 | Tragic 44.0% |
| Seminole | 0.4 /100 | #252 | Tragic 44.0% |
| Central Americans | 0.3 /100 | #253 | Tragic 43.9% |
| Apache | 0.3 /100 | #254 | Tragic 43.9% |
| Shoshone | 0.3 /100 | #255 | Tragic 43.9% |
| Ugandans | 0.3 /100 | #256 | Tragic 43.8% |
| Blackfeet | 0.2 /100 | #257 | Tragic 43.8% |
| Central American Indians | 0.2 /100 | #258 | Tragic 43.8% |
| Iroquois | 0.2 /100 | #259 | Tragic 43.7% |
| Immigrants | Cameroon | 0.2 /100 | #260 | Tragic 43.7% |
| Alaskan Athabascans | 0.2 /100 | #261 | Tragic 43.6% |
| Vietnamese | 0.2 /100 | #262 | Tragic 43.6% |
| Cree | 0.1 /100 | #263 | Tragic 43.6% |
| Bangladeshis | 0.1 /100 | #264 | Tragic 43.5% |
Demographics Similar to Somalis by Married-couple Households
In terms of married-couple households, the demographic groups most similar to Somalis are Immigrants from West Indies (39.0%, a difference of 0.030%), Immigrants from Congo (39.0%, a difference of 0.090%), Immigrants from Barbados (39.2%, a difference of 0.52%), Immigrants from St. Vincent and the Grenadines (38.7%, a difference of 0.81%), and Immigrants from Dominica (39.4%, a difference of 0.96%).
| Demographics | Rating | Rank | Married-couple Households |
| Pueblo | 0.0 /100 | #325 | Tragic 40.0% |
| U.S. Virgin Islanders | 0.0 /100 | #326 | Tragic 39.8% |
| Lumbee | 0.0 /100 | #327 | Tragic 39.6% |
| Barbadians | 0.0 /100 | #328 | Tragic 39.4% |
| Immigrants | Dominica | 0.0 /100 | #329 | Tragic 39.4% |
| Immigrants | Barbados | 0.0 /100 | #330 | Tragic 39.2% |
| Immigrants | Congo | 0.0 /100 | #331 | Tragic 39.0% |
| Somalis | 0.0 /100 | #332 | Tragic 39.0% |
| Immigrants | West Indies | 0.0 /100 | #333 | Tragic 39.0% |
| Immigrants | St. Vincent and the Grenadines | 0.0 /100 | #334 | Tragic 38.7% |
| Senegalese | 0.0 /100 | #335 | Tragic 38.6% |
| Blacks/African Americans | 0.0 /100 | #336 | Tragic 38.5% |
| Immigrants | Somalia | 0.0 /100 | #337 | Tragic 38.4% |
| Immigrants | Senegal | 0.0 /100 | #338 | Tragic 38.4% |
| British West Indians | 0.0 /100 | #339 | Tragic 38.3% |