Pueblo vs Palestinian Currently Married
COMPARE
Pueblo
Palestinian
Currently Married
Currently Married Comparison
Pueblo
Palestinians
38.2%
CURRENTLY MARRIED
0.0/ 100
METRIC RATING
343rd/ 347
METRIC RANK
47.6%
CURRENTLY MARRIED
90.4/ 100
METRIC RATING
116th/ 347
METRIC RANK
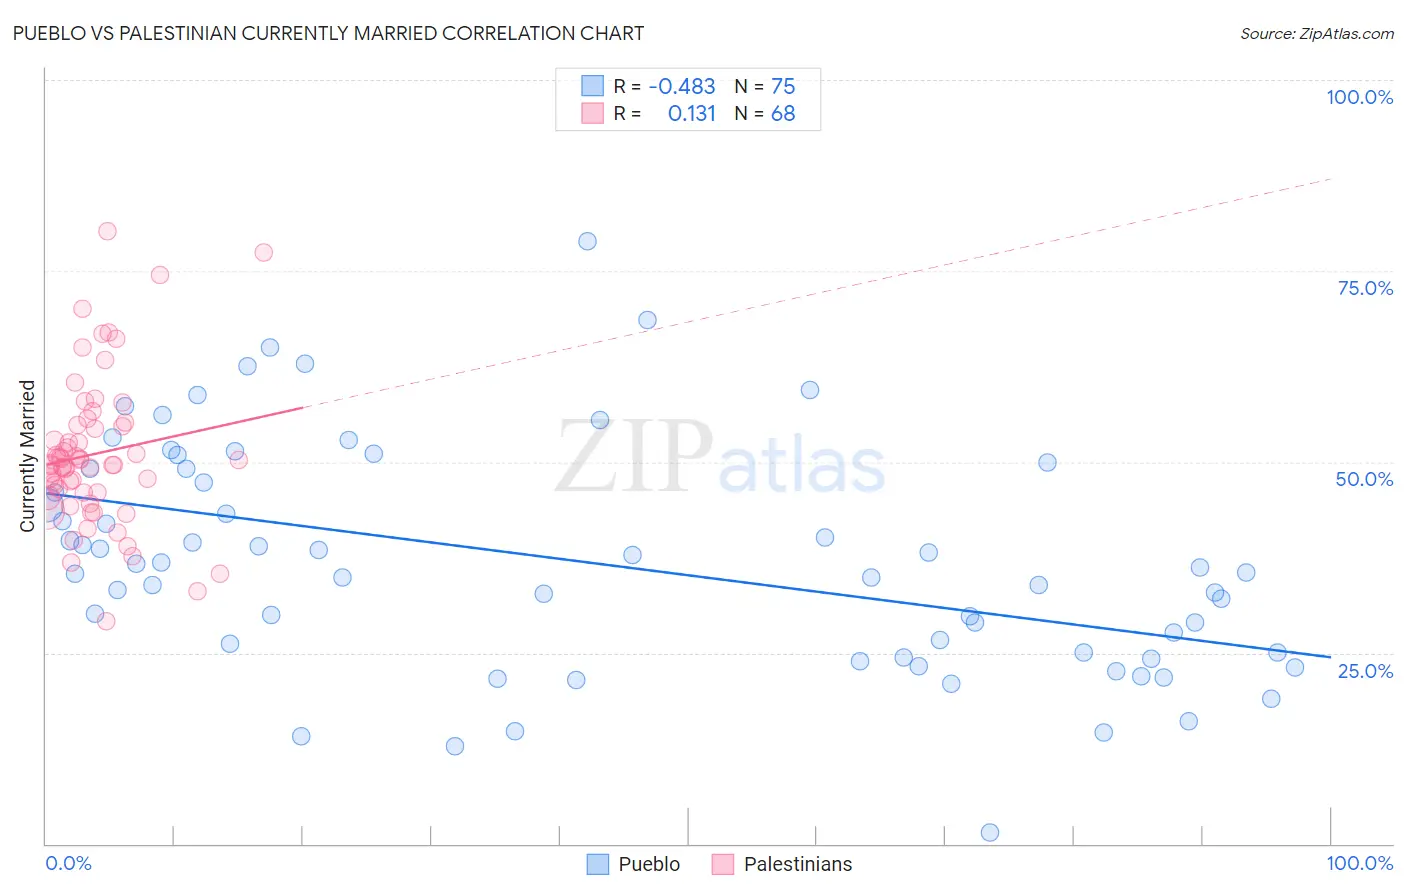
Pueblo vs Palestinian Currently Married Correlation Chart
The statistical analysis conducted on geographies consisting of 120,084,421 people shows a moderate negative correlation between the proportion of Pueblo and percentage of population currently married in the United States with a correlation coefficient (R) of -0.483 and weighted average of 38.2%. Similarly, the statistical analysis conducted on geographies consisting of 216,437,079 people shows a poor positive correlation between the proportion of Palestinians and percentage of population currently married in the United States with a correlation coefficient (R) of 0.131 and weighted average of 47.6%, a difference of 24.5%.
Currently Married Correlation Summary
| Measurement | Pueblo | Palestinian |
| Minimum | 1.5% | 29.1% |
| Maximum | 78.9% | 80.2% |
| Range | 77.4% | 51.1% |
| Mean | 36.9% | 51.0% |
| Median | 35.5% | 49.7% |
| Interquartile 25% (IQ1) | 25.0% | 46.0% |
| Interquartile 75% (IQ3) | 49.1% | 54.7% |
| Interquartile Range (IQR) | 24.0% | 8.7% |
| Standard Deviation (Sample) | 14.9% | 9.7% |
| Standard Deviation (Population) | 14.8% | 9.7% |
Similar Demographics by Currently Married
Demographics Similar to Pueblo by Currently Married
In terms of currently married, the demographic groups most similar to Pueblo are Immigrants from Cabo Verde (37.8%, a difference of 1.1%), Immigrants from Dominican Republic (38.9%, a difference of 1.8%), Navajo (39.0%, a difference of 2.0%), Immigrants from Grenada (39.1%, a difference of 2.4%), and Dominican (39.5%, a difference of 3.4%).
| Demographics | Rating | Rank | Currently Married |
| Yup'ik | 0.0 /100 | #333 | Tragic 39.9% |
| Puerto Ricans | 0.0 /100 | #334 | Tragic 39.9% |
| Lumbee | 0.0 /100 | #335 | Tragic 39.8% |
| British West Indians | 0.0 /100 | #336 | Tragic 39.8% |
| Blacks/African Americans | 0.0 /100 | #337 | Tragic 39.6% |
| Cape Verdeans | 0.0 /100 | #338 | Tragic 39.6% |
| Dominicans | 0.0 /100 | #339 | Tragic 39.5% |
| Immigrants | Grenada | 0.0 /100 | #340 | Tragic 39.1% |
| Navajo | 0.0 /100 | #341 | Tragic 39.0% |
| Immigrants | Dominican Republic | 0.0 /100 | #342 | Tragic 38.9% |
| Pueblo | 0.0 /100 | #343 | Tragic 38.2% |
| Immigrants | Cabo Verde | 0.0 /100 | #344 | Tragic 37.8% |
| Tohono O'odham | 0.0 /100 | #345 | Tragic 36.8% |
| Hopi | 0.0 /100 | #346 | Tragic 36.5% |
| Pima | 0.0 /100 | #347 | Tragic 35.9% |
Demographics Similar to Palestinians by Currently Married
In terms of currently married, the demographic groups most similar to Palestinians are South African (47.6%, a difference of 0.010%), Immigrants from Indonesia (47.6%, a difference of 0.010%), Puget Sound Salish (47.6%, a difference of 0.020%), Immigrants from Philippines (47.6%, a difference of 0.020%), and Australian (47.6%, a difference of 0.020%).
| Demographics | Rating | Rank | Currently Married |
| Immigrants | Egypt | 92.3 /100 | #109 | Exceptional 47.7% |
| Immigrants | Russia | 92.0 /100 | #110 | Exceptional 47.7% |
| Immigrants | Hungary | 91.2 /100 | #111 | Exceptional 47.6% |
| Immigrants | Western Europe | 91.1 /100 | #112 | Exceptional 47.6% |
| Immigrants | Denmark | 90.9 /100 | #113 | Exceptional 47.6% |
| South Africans | 90.5 /100 | #114 | Exceptional 47.6% |
| Immigrants | Indonesia | 90.5 /100 | #115 | Exceptional 47.6% |
| Palestinians | 90.4 /100 | #116 | Exceptional 47.6% |
| Puget Sound Salish | 90.3 /100 | #117 | Exceptional 47.6% |
| Immigrants | Philippines | 90.2 /100 | #118 | Exceptional 47.6% |
| Australians | 90.2 /100 | #119 | Exceptional 47.6% |
| Syrians | 88.9 /100 | #120 | Excellent 47.5% |
| Immigrants | Croatia | 88.6 /100 | #121 | Excellent 47.5% |
| Osage | 87.9 /100 | #122 | Excellent 47.5% |
| Immigrants | Kazakhstan | 87.2 /100 | #123 | Excellent 47.4% |