Inupiat vs Palestinian Currently Married
COMPARE
Inupiat
Palestinian
Currently Married
Currently Married Comparison
Inupiat
Palestinians
41.3%
CURRENTLY MARRIED
0.0/ 100
METRIC RATING
315th/ 347
METRIC RANK
47.6%
CURRENTLY MARRIED
90.4/ 100
METRIC RATING
116th/ 347
METRIC RANK
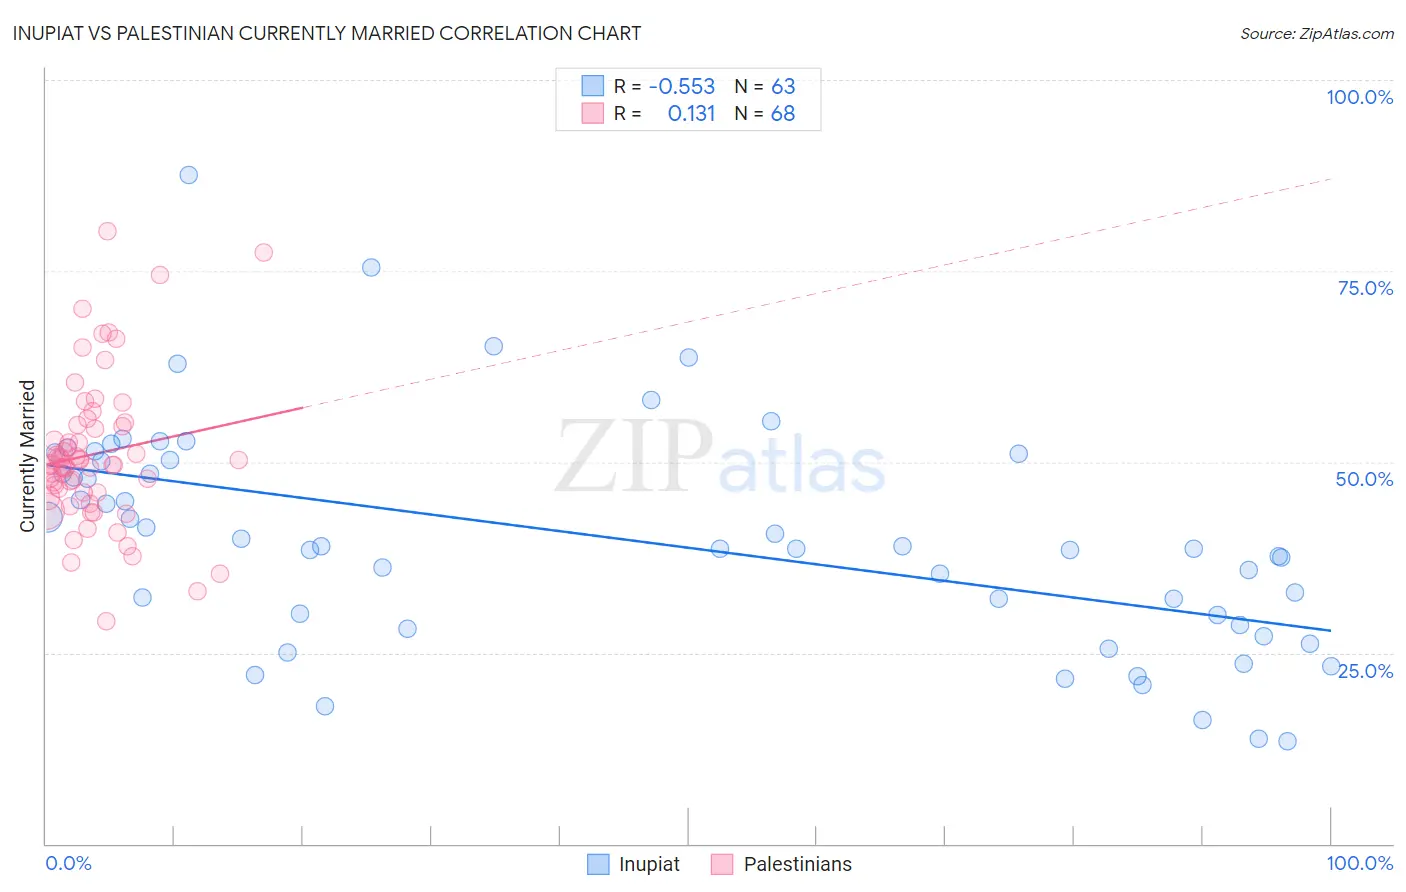
Inupiat vs Palestinian Currently Married Correlation Chart
The statistical analysis conducted on geographies consisting of 96,349,193 people shows a substantial negative correlation between the proportion of Inupiat and percentage of population currently married in the United States with a correlation coefficient (R) of -0.553 and weighted average of 41.3%. Similarly, the statistical analysis conducted on geographies consisting of 216,437,079 people shows a poor positive correlation between the proportion of Palestinians and percentage of population currently married in the United States with a correlation coefficient (R) of 0.131 and weighted average of 47.6%, a difference of 15.3%.
Currently Married Correlation Summary
| Measurement | Inupiat | Palestinian |
| Minimum | 13.5% | 29.1% |
| Maximum | 87.5% | 80.2% |
| Range | 74.0% | 51.1% |
| Mean | 40.0% | 51.0% |
| Median | 38.7% | 49.7% |
| Interquartile 25% (IQ1) | 28.7% | 46.0% |
| Interquartile 75% (IQ3) | 50.3% | 54.7% |
| Interquartile Range (IQR) | 21.6% | 8.7% |
| Standard Deviation (Sample) | 14.7% | 9.7% |
| Standard Deviation (Population) | 14.6% | 9.7% |
Similar Demographics by Currently Married
Demographics Similar to Inupiat by Currently Married
In terms of currently married, the demographic groups most similar to Inupiat are Immigrants from Caribbean (41.3%, a difference of 0.060%), Haitian (41.3%, a difference of 0.080%), West Indian (41.3%, a difference of 0.090%), Jamaican (41.4%, a difference of 0.16%), and Bahamian (41.2%, a difference of 0.26%).
| Demographics | Rating | Rank | Currently Married |
| Immigrants | Belize | 0.0 /100 | #308 | Tragic 41.8% |
| Immigrants | Liberia | 0.0 /100 | #309 | Tragic 41.8% |
| Guyanese | 0.0 /100 | #310 | Tragic 41.6% |
| Trinidadians and Tobagonians | 0.0 /100 | #311 | Tragic 41.5% |
| Somalis | 0.0 /100 | #312 | Tragic 41.5% |
| Jamaicans | 0.0 /100 | #313 | Tragic 41.4% |
| West Indians | 0.0 /100 | #314 | Tragic 41.3% |
| Inupiat | 0.0 /100 | #315 | Tragic 41.3% |
| Immigrants | Caribbean | 0.0 /100 | #316 | Tragic 41.3% |
| Haitians | 0.0 /100 | #317 | Tragic 41.3% |
| Bahamians | 0.0 /100 | #318 | Tragic 41.2% |
| Immigrants | Somalia | 0.0 /100 | #319 | Tragic 41.2% |
| Immigrants | Jamaica | 0.0 /100 | #320 | Tragic 41.1% |
| Immigrants | Congo | 0.0 /100 | #321 | Tragic 41.1% |
| Immigrants | Haiti | 0.0 /100 | #322 | Tragic 41.0% |
Demographics Similar to Palestinians by Currently Married
In terms of currently married, the demographic groups most similar to Palestinians are South African (47.6%, a difference of 0.010%), Immigrants from Indonesia (47.6%, a difference of 0.010%), Puget Sound Salish (47.6%, a difference of 0.020%), Immigrants from Philippines (47.6%, a difference of 0.020%), and Australian (47.6%, a difference of 0.020%).
| Demographics | Rating | Rank | Currently Married |
| Immigrants | Egypt | 92.3 /100 | #109 | Exceptional 47.7% |
| Immigrants | Russia | 92.0 /100 | #110 | Exceptional 47.7% |
| Immigrants | Hungary | 91.2 /100 | #111 | Exceptional 47.6% |
| Immigrants | Western Europe | 91.1 /100 | #112 | Exceptional 47.6% |
| Immigrants | Denmark | 90.9 /100 | #113 | Exceptional 47.6% |
| South Africans | 90.5 /100 | #114 | Exceptional 47.6% |
| Immigrants | Indonesia | 90.5 /100 | #115 | Exceptional 47.6% |
| Palestinians | 90.4 /100 | #116 | Exceptional 47.6% |
| Puget Sound Salish | 90.3 /100 | #117 | Exceptional 47.6% |
| Immigrants | Philippines | 90.2 /100 | #118 | Exceptional 47.6% |
| Australians | 90.2 /100 | #119 | Exceptional 47.6% |
| Syrians | 88.9 /100 | #120 | Excellent 47.5% |
| Immigrants | Croatia | 88.6 /100 | #121 | Excellent 47.5% |
| Osage | 87.9 /100 | #122 | Excellent 47.5% |
| Immigrants | Kazakhstan | 87.2 /100 | #123 | Excellent 47.4% |