Barbadian vs Palestinian Currently Married
COMPARE
Barbadian
Palestinian
Currently Married
Currently Married Comparison
Barbadians
Palestinians
40.6%
CURRENTLY MARRIED
0.0/ 100
METRIC RATING
326th/ 347
METRIC RANK
47.6%
CURRENTLY MARRIED
90.4/ 100
METRIC RATING
116th/ 347
METRIC RANK
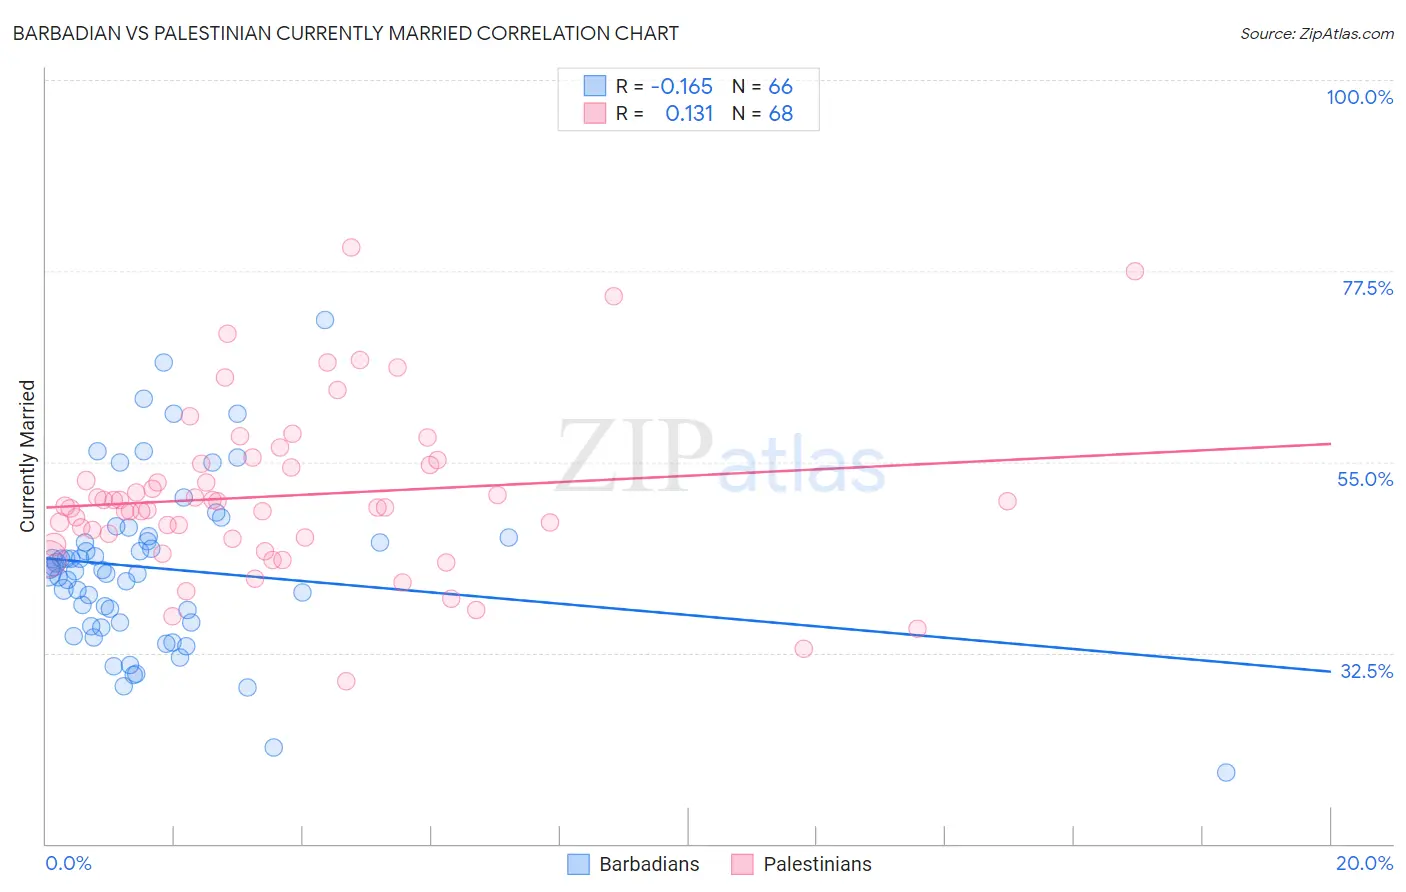
Barbadian vs Palestinian Currently Married Correlation Chart
The statistical analysis conducted on geographies consisting of 141,300,179 people shows a poor negative correlation between the proportion of Barbadians and percentage of population currently married in the United States with a correlation coefficient (R) of -0.165 and weighted average of 40.6%. Similarly, the statistical analysis conducted on geographies consisting of 216,437,079 people shows a poor positive correlation between the proportion of Palestinians and percentage of population currently married in the United States with a correlation coefficient (R) of 0.131 and weighted average of 47.6%, a difference of 17.1%.
Currently Married Correlation Summary
| Measurement | Barbadian | Palestinian |
| Minimum | 18.4% | 29.1% |
| Maximum | 71.7% | 80.2% |
| Range | 53.3% | 51.1% |
| Mean | 42.5% | 51.0% |
| Median | 42.2% | 49.7% |
| Interquartile 25% (IQ1) | 36.0% | 46.0% |
| Interquartile 75% (IQ3) | 46.1% | 54.7% |
| Interquartile Range (IQR) | 10.1% | 8.7% |
| Standard Deviation (Sample) | 9.9% | 9.7% |
| Standard Deviation (Population) | 9.9% | 9.7% |
Similar Demographics by Currently Married
Demographics Similar to Barbadians by Currently Married
In terms of currently married, the demographic groups most similar to Barbadians are U.S. Virgin Islander (40.7%, a difference of 0.14%), Senegalese (40.6%, a difference of 0.17%), Immigrants from Senegal (40.7%, a difference of 0.19%), Immigrants from West Indies (40.7%, a difference of 0.20%), and Arapaho (40.5%, a difference of 0.22%).
| Demographics | Rating | Rank | Currently Married |
| Immigrants | Somalia | 0.0 /100 | #319 | Tragic 41.2% |
| Immigrants | Jamaica | 0.0 /100 | #320 | Tragic 41.1% |
| Immigrants | Congo | 0.0 /100 | #321 | Tragic 41.1% |
| Immigrants | Haiti | 0.0 /100 | #322 | Tragic 41.0% |
| Immigrants | West Indies | 0.0 /100 | #323 | Tragic 40.7% |
| Immigrants | Senegal | 0.0 /100 | #324 | Tragic 40.7% |
| U.S. Virgin Islanders | 0.0 /100 | #325 | Tragic 40.7% |
| Barbadians | 0.0 /100 | #326 | Tragic 40.6% |
| Senegalese | 0.0 /100 | #327 | Tragic 40.6% |
| Arapaho | 0.0 /100 | #328 | Tragic 40.5% |
| Crow | 0.0 /100 | #329 | Tragic 40.4% |
| Immigrants | Dominica | 0.0 /100 | #330 | Tragic 40.3% |
| Immigrants | Barbados | 0.0 /100 | #331 | Tragic 40.3% |
| Immigrants | St. Vincent and the Grenadines | 0.0 /100 | #332 | Tragic 40.1% |
| Yup'ik | 0.0 /100 | #333 | Tragic 39.9% |
Demographics Similar to Palestinians by Currently Married
In terms of currently married, the demographic groups most similar to Palestinians are South African (47.6%, a difference of 0.010%), Immigrants from Indonesia (47.6%, a difference of 0.010%), Puget Sound Salish (47.6%, a difference of 0.020%), Immigrants from Philippines (47.6%, a difference of 0.020%), and Australian (47.6%, a difference of 0.020%).
| Demographics | Rating | Rank | Currently Married |
| Immigrants | Egypt | 92.3 /100 | #109 | Exceptional 47.7% |
| Immigrants | Russia | 92.0 /100 | #110 | Exceptional 47.7% |
| Immigrants | Hungary | 91.2 /100 | #111 | Exceptional 47.6% |
| Immigrants | Western Europe | 91.1 /100 | #112 | Exceptional 47.6% |
| Immigrants | Denmark | 90.9 /100 | #113 | Exceptional 47.6% |
| South Africans | 90.5 /100 | #114 | Exceptional 47.6% |
| Immigrants | Indonesia | 90.5 /100 | #115 | Exceptional 47.6% |
| Palestinians | 90.4 /100 | #116 | Exceptional 47.6% |
| Puget Sound Salish | 90.3 /100 | #117 | Exceptional 47.6% |
| Immigrants | Philippines | 90.2 /100 | #118 | Exceptional 47.6% |
| Australians | 90.2 /100 | #119 | Exceptional 47.6% |
| Syrians | 88.9 /100 | #120 | Excellent 47.5% |
| Immigrants | Croatia | 88.6 /100 | #121 | Excellent 47.5% |
| Osage | 87.9 /100 | #122 | Excellent 47.5% |
| Immigrants | Kazakhstan | 87.2 /100 | #123 | Excellent 47.4% |