Bhutanese vs English Divorced or Separated
COMPARE
Bhutanese
English
Divorced or Separated
Divorced or Separated Comparison
Bhutanese
English
11.2%
DIVORCED OR SEPARATED
100.0/ 100
METRIC RATING
41st/ 347
METRIC RANK
12.6%
DIVORCED OR SEPARATED
0.5/ 100
METRIC RATING
264th/ 347
METRIC RANK
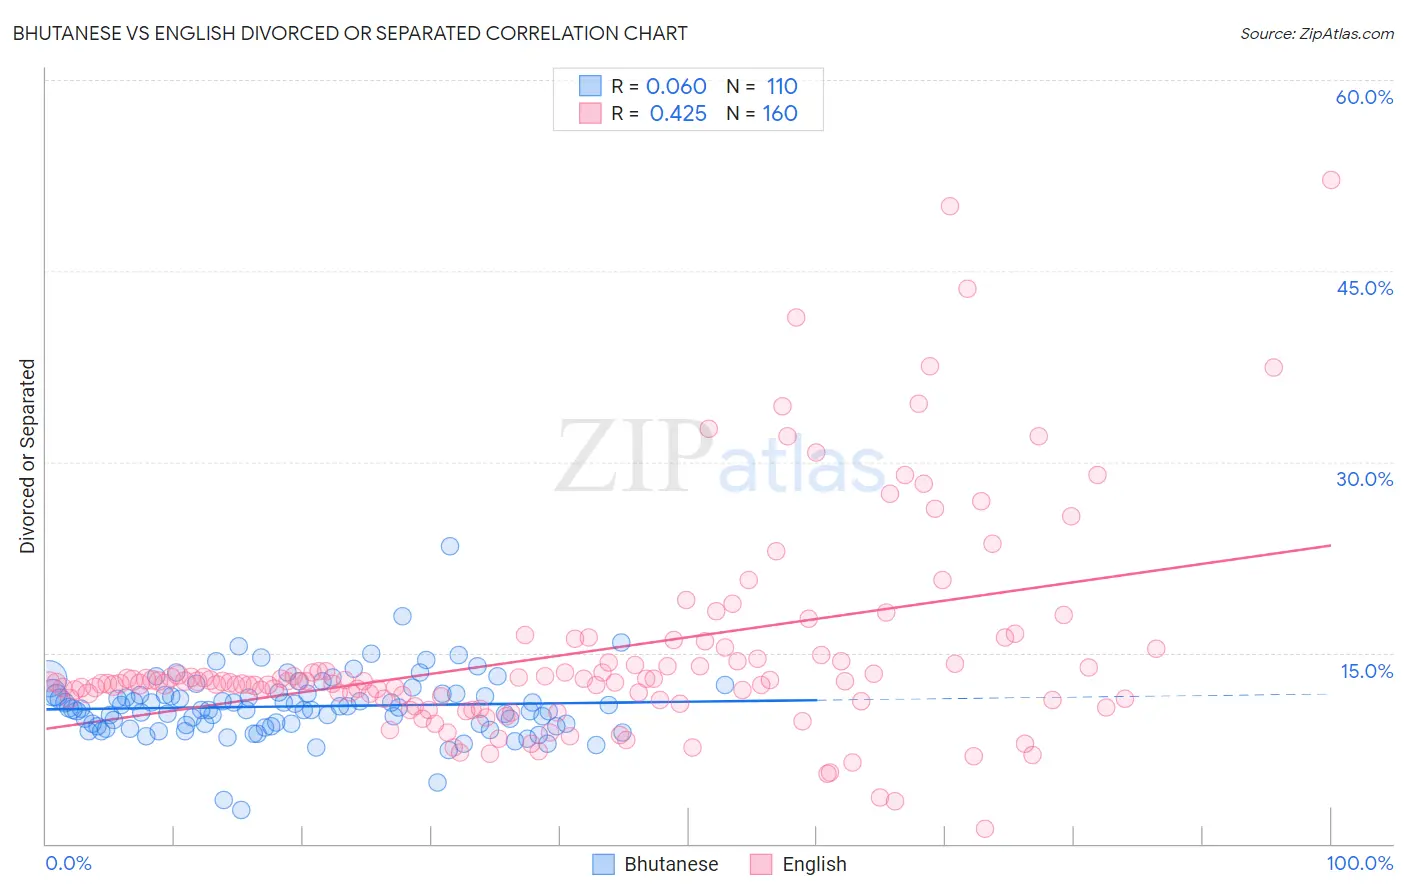
Bhutanese vs English Divorced or Separated Correlation Chart
The statistical analysis conducted on geographies consisting of 455,285,816 people shows a slight positive correlation between the proportion of Bhutanese and percentage of population currently divorced or separated in the United States with a correlation coefficient (R) of 0.060 and weighted average of 11.2%. Similarly, the statistical analysis conducted on geographies consisting of 579,335,226 people shows a moderate positive correlation between the proportion of English and percentage of population currently divorced or separated in the United States with a correlation coefficient (R) of 0.425 and weighted average of 12.6%, a difference of 12.9%.
Divorced or Separated Correlation Summary
| Measurement | Bhutanese | English |
| Minimum | 2.7% | 1.2% |
| Maximum | 23.4% | 52.1% |
| Range | 20.7% | 50.9% |
| Mean | 10.8% | 14.9% |
| Median | 10.6% | 12.8% |
| Interquartile 25% (IQ1) | 9.3% | 11.3% |
| Interquartile 75% (IQ3) | 11.8% | 14.4% |
| Interquartile Range (IQR) | 2.5% | 3.1% |
| Standard Deviation (Sample) | 2.6% | 8.2% |
| Standard Deviation (Population) | 2.6% | 8.2% |
Similar Demographics by Divorced or Separated
Demographics Similar to Bhutanese by Divorced or Separated
In terms of divorced or separated, the demographic groups most similar to Bhutanese are Chinese (11.2%, a difference of 0.060%), Immigrants from Belarus (11.2%, a difference of 0.070%), Immigrants from Western Asia (11.2%, a difference of 0.090%), Turkish (11.2%, a difference of 0.13%), and Laotian (11.2%, a difference of 0.24%).
| Demographics | Rating | Rank | Divorced or Separated |
| Immigrants | Uzbekistan | 100.0 /100 | #34 | Exceptional 11.1% |
| Cambodians | 100.0 /100 | #35 | Exceptional 11.1% |
| Immigrants | Japan | 100.0 /100 | #36 | Exceptional 11.1% |
| Immigrants | Lebanon | 100.0 /100 | #37 | Exceptional 11.1% |
| Immigrants | Greece | 100.0 /100 | #38 | Exceptional 11.1% |
| Immigrants | Egypt | 100.0 /100 | #39 | Exceptional 11.1% |
| Soviet Union | 100.0 /100 | #40 | Exceptional 11.1% |
| Bhutanese | 100.0 /100 | #41 | Exceptional 11.2% |
| Chinese | 100.0 /100 | #42 | Exceptional 11.2% |
| Immigrants | Belarus | 100.0 /100 | #43 | Exceptional 11.2% |
| Immigrants | Western Asia | 100.0 /100 | #44 | Exceptional 11.2% |
| Turks | 100.0 /100 | #45 | Exceptional 11.2% |
| Laotians | 100.0 /100 | #46 | Exceptional 11.2% |
| Immigrants | Poland | 100.0 /100 | #47 | Exceptional 11.2% |
| Immigrants | Turkey | 100.0 /100 | #48 | Exceptional 11.2% |
Demographics Similar to English by Divorced or Separated
In terms of divorced or separated, the demographic groups most similar to English are Immigrants from Panama (12.6%, a difference of 0.020%), Immigrants from Senegal (12.6%, a difference of 0.020%), White/Caucasian (12.6%, a difference of 0.030%), Basque (12.6%, a difference of 0.070%), and Scottish (12.6%, a difference of 0.070%).
| Demographics | Rating | Rank | Divorced or Separated |
| Immigrants | Somalia | 0.6 /100 | #257 | Tragic 12.6% |
| Indonesians | 0.6 /100 | #258 | Tragic 12.6% |
| Yuman | 0.6 /100 | #259 | Tragic 12.6% |
| Immigrants | Uruguay | 0.6 /100 | #260 | Tragic 12.6% |
| Immigrants | Dominica | 0.5 /100 | #261 | Tragic 12.6% |
| Basques | 0.5 /100 | #262 | Tragic 12.6% |
| Immigrants | Panama | 0.5 /100 | #263 | Tragic 12.6% |
| English | 0.5 /100 | #264 | Tragic 12.6% |
| Immigrants | Senegal | 0.5 /100 | #265 | Tragic 12.6% |
| Whites/Caucasians | 0.5 /100 | #266 | Tragic 12.6% |
| Scottish | 0.4 /100 | #267 | Tragic 12.6% |
| Fijians | 0.4 /100 | #268 | Tragic 12.6% |
| Immigrants | Liberia | 0.4 /100 | #269 | Tragic 12.6% |
| Ute | 0.4 /100 | #270 | Tragic 12.6% |
| Panamanians | 0.3 /100 | #271 | Tragic 12.7% |