Korean vs Kenyan Divorced or Separated
COMPARE
Korean
Kenyan
Divorced or Separated
Divorced or Separated Comparison
Koreans
Kenyans
11.3%
DIVORCED OR SEPARATED
99.9/ 100
METRIC RATING
61st/ 347
METRIC RANK
12.2%
DIVORCED OR SEPARATED
21.8/ 100
METRIC RATING
204th/ 347
METRIC RANK
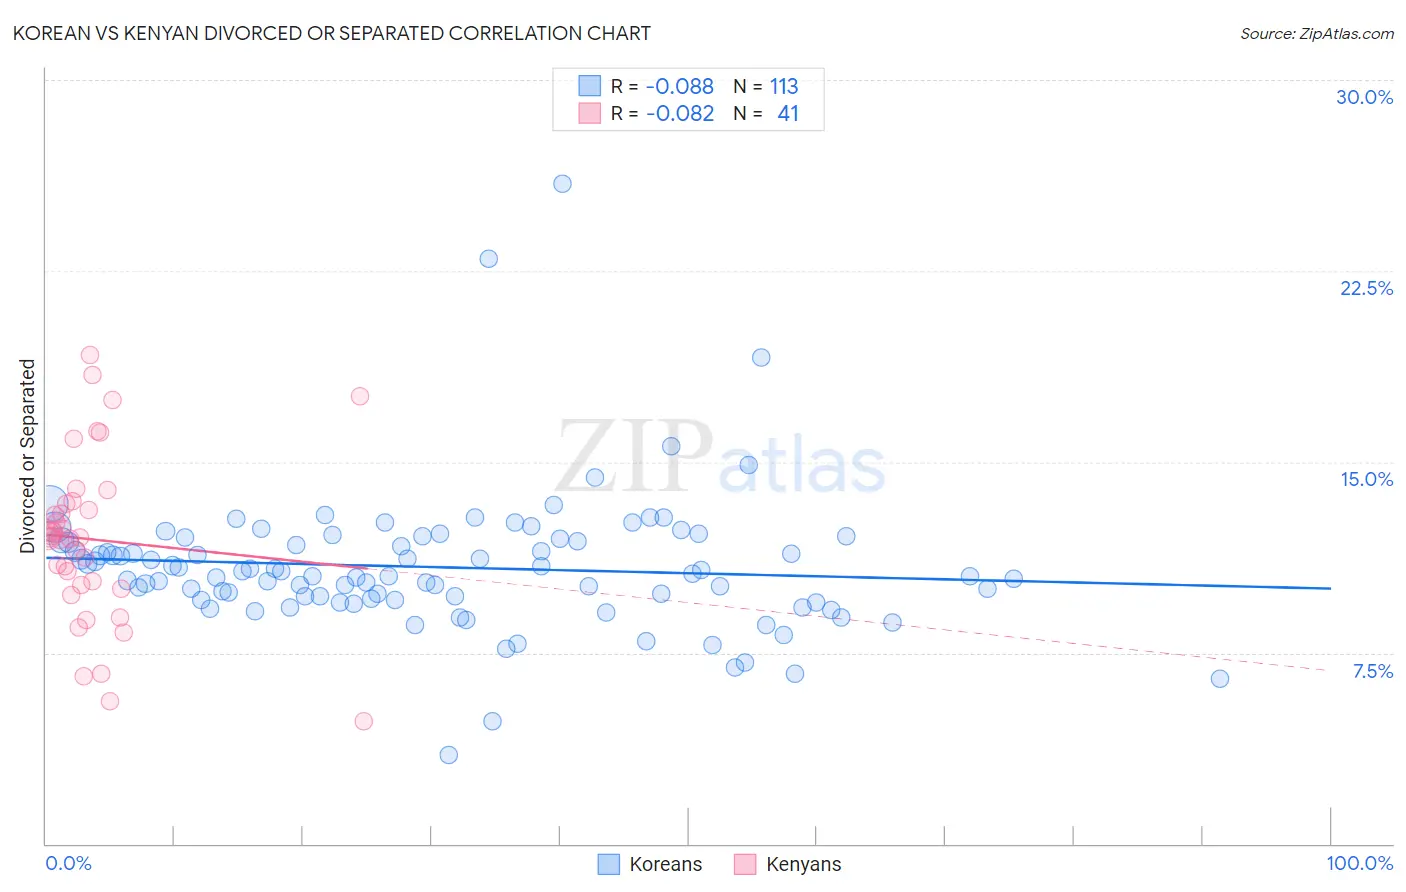
Korean vs Kenyan Divorced or Separated Correlation Chart
The statistical analysis conducted on geographies consisting of 510,579,810 people shows a slight negative correlation between the proportion of Koreans and percentage of population currently divorced or separated in the United States with a correlation coefficient (R) of -0.088 and weighted average of 11.3%. Similarly, the statistical analysis conducted on geographies consisting of 168,184,895 people shows a slight negative correlation between the proportion of Kenyans and percentage of population currently divorced or separated in the United States with a correlation coefficient (R) of -0.082 and weighted average of 12.2%, a difference of 7.4%.
Divorced or Separated Correlation Summary
| Measurement | Korean | Kenyan |
| Minimum | 3.5% | 4.8% |
| Maximum | 25.9% | 19.2% |
| Range | 22.4% | 14.4% |
| Mean | 10.9% | 11.9% |
| Median | 10.6% | 12.0% |
| Interquartile 25% (IQ1) | 9.6% | 10.1% |
| Interquartile 75% (IQ3) | 12.0% | 13.4% |
| Interquartile Range (IQR) | 2.4% | 3.3% |
| Standard Deviation (Sample) | 2.7% | 3.3% |
| Standard Deviation (Population) | 2.7% | 3.3% |
Similar Demographics by Divorced or Separated
Demographics Similar to Koreans by Divorced or Separated
In terms of divorced or separated, the demographic groups most similar to Koreans are Luxembourger (11.3%, a difference of 0.0%), Immigrants from Russia (11.3%, a difference of 0.010%), Immigrants from Kuwait (11.3%, a difference of 0.010%), Israeli (11.3%, a difference of 0.17%), and Sri Lankan (11.3%, a difference of 0.26%).
| Demographics | Rating | Rank | Divorced or Separated |
| Eastern Europeans | 99.9 /100 | #54 | Exceptional 11.3% |
| Immigrants | Yemen | 99.9 /100 | #55 | Exceptional 11.3% |
| Immigrants | Philippines | 99.9 /100 | #56 | Exceptional 11.3% |
| Immigrants | Vietnam | 99.9 /100 | #57 | Exceptional 11.3% |
| Sri Lankans | 99.9 /100 | #58 | Exceptional 11.3% |
| Israelis | 99.9 /100 | #59 | Exceptional 11.3% |
| Immigrants | Russia | 99.9 /100 | #60 | Exceptional 11.3% |
| Koreans | 99.9 /100 | #61 | Exceptional 11.3% |
| Luxembourgers | 99.9 /100 | #62 | Exceptional 11.3% |
| Immigrants | Kuwait | 99.9 /100 | #63 | Exceptional 11.3% |
| Macedonians | 99.8 /100 | #64 | Exceptional 11.4% |
| Immigrants | South Eastern Asia | 99.8 /100 | #65 | Exceptional 11.4% |
| Inupiat | 99.8 /100 | #66 | Exceptional 11.4% |
| Immigrants | Syria | 99.7 /100 | #67 | Exceptional 11.4% |
| Palestinians | 99.7 /100 | #68 | Exceptional 11.5% |
Demographics Similar to Kenyans by Divorced or Separated
In terms of divorced or separated, the demographic groups most similar to Kenyans are Immigrants from Costa Rica (12.2%, a difference of 0.030%), Slovak (12.2%, a difference of 0.040%), Mexican (12.2%, a difference of 0.040%), Immigrants from Guatemala (12.2%, a difference of 0.070%), and Portuguese (12.2%, a difference of 0.080%).
| Demographics | Rating | Rank | Divorced or Separated |
| Immigrants | Africa | 30.3 /100 | #197 | Fair 12.1% |
| Nigerians | 30.1 /100 | #198 | Fair 12.1% |
| Central Americans | 29.4 /100 | #199 | Fair 12.1% |
| South Americans | 28.6 /100 | #200 | Fair 12.2% |
| Guatemalans | 26.9 /100 | #201 | Fair 12.2% |
| Portuguese | 23.5 /100 | #202 | Fair 12.2% |
| Immigrants | Guatemala | 23.2 /100 | #203 | Fair 12.2% |
| Kenyans | 21.8 /100 | #204 | Fair 12.2% |
| Immigrants | Costa Rica | 21.3 /100 | #205 | Fair 12.2% |
| Slovaks | 21.0 /100 | #206 | Fair 12.2% |
| Mexicans | 21.0 /100 | #207 | Fair 12.2% |
| Immigrants | Ghana | 18.8 /100 | #208 | Poor 12.2% |
| Immigrants | Trinidad and Tobago | 17.8 /100 | #209 | Poor 12.2% |
| Slavs | 17.0 /100 | #210 | Poor 12.2% |
| Trinidadians and Tobagonians | 16.6 /100 | #211 | Poor 12.2% |