Canadian vs Kenyan Divorced or Separated
COMPARE
Canadian
Kenyan
Divorced or Separated
Divorced or Separated Comparison
Canadians
Kenyans
12.4%
DIVORCED OR SEPARATED
5.3/ 100
METRIC RATING
232nd/ 347
METRIC RANK
12.2%
DIVORCED OR SEPARATED
21.8/ 100
METRIC RATING
204th/ 347
METRIC RANK
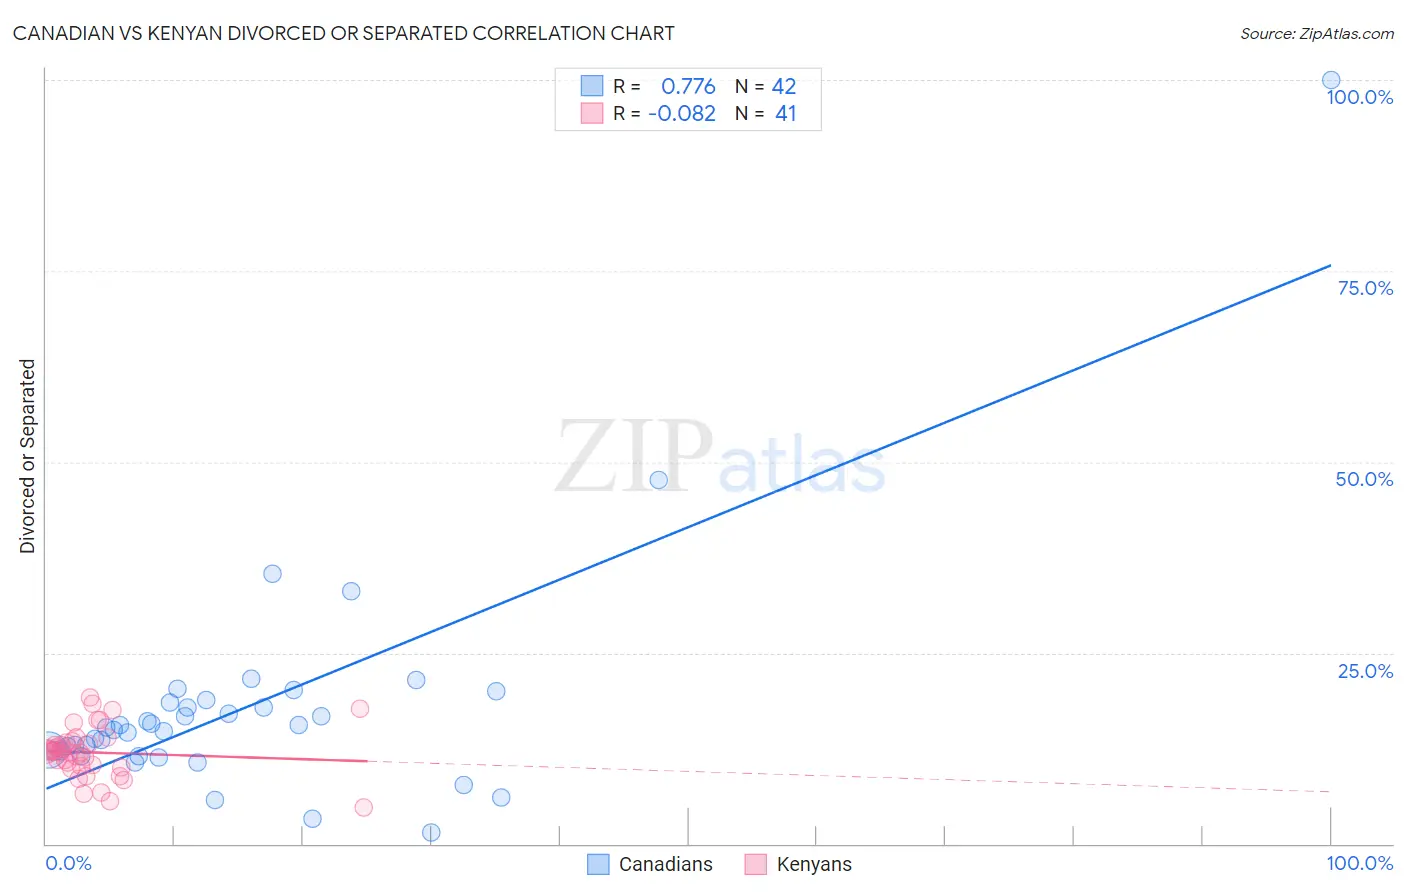
Canadian vs Kenyan Divorced or Separated Correlation Chart
The statistical analysis conducted on geographies consisting of 437,381,276 people shows a strong positive correlation between the proportion of Canadians and percentage of population currently divorced or separated in the United States with a correlation coefficient (R) of 0.776 and weighted average of 12.4%. Similarly, the statistical analysis conducted on geographies consisting of 168,184,895 people shows a slight negative correlation between the proportion of Kenyans and percentage of population currently divorced or separated in the United States with a correlation coefficient (R) of -0.082 and weighted average of 12.2%, a difference of 1.4%.
Divorced or Separated Correlation Summary
| Measurement | Canadian | Kenyan |
| Minimum | 1.4% | 4.8% |
| Maximum | 100.0% | 19.2% |
| Range | 98.6% | 14.4% |
| Mean | 17.8% | 11.9% |
| Median | 15.1% | 12.0% |
| Interquartile 25% (IQ1) | 12.1% | 10.1% |
| Interquartile 75% (IQ3) | 18.4% | 13.4% |
| Interquartile Range (IQR) | 6.3% | 3.3% |
| Standard Deviation (Sample) | 15.3% | 3.3% |
| Standard Deviation (Population) | 15.1% | 3.3% |
Similar Demographics by Divorced or Separated
Demographics Similar to Canadians by Divorced or Separated
In terms of divorced or separated, the demographic groups most similar to Canadians are Malaysian (12.4%, a difference of 0.090%), West Indian (12.4%, a difference of 0.17%), Yugoslavian (12.3%, a difference of 0.19%), Immigrants from Bosnia and Herzegovina (12.4%, a difference of 0.19%), and Colombian (12.4%, a difference of 0.21%).
| Demographics | Rating | Rank | Divorced or Separated |
| Belgians | 9.7 /100 | #225 | Tragic 12.3% |
| Immigrants | Western Africa | 9.3 /100 | #226 | Tragic 12.3% |
| Hmong | 8.8 /100 | #227 | Tragic 12.3% |
| Immigrants | Cameroon | 8.3 /100 | #228 | Tragic 12.3% |
| Immigrants | Sudan | 8.2 /100 | #229 | Tragic 12.3% |
| Yakama | 7.8 /100 | #230 | Tragic 12.3% |
| Yugoslavians | 6.6 /100 | #231 | Tragic 12.3% |
| Canadians | 5.3 /100 | #232 | Tragic 12.4% |
| Malaysians | 4.8 /100 | #233 | Tragic 12.4% |
| West Indians | 4.4 /100 | #234 | Tragic 12.4% |
| Immigrants | Bosnia and Herzegovina | 4.3 /100 | #235 | Tragic 12.4% |
| Colombians | 4.2 /100 | #236 | Tragic 12.4% |
| Immigrants | Laos | 4.2 /100 | #237 | Tragic 12.4% |
| Sudanese | 4.0 /100 | #238 | Tragic 12.4% |
| Immigrants | Germany | 4.0 /100 | #239 | Tragic 12.4% |
Demographics Similar to Kenyans by Divorced or Separated
In terms of divorced or separated, the demographic groups most similar to Kenyans are Immigrants from Costa Rica (12.2%, a difference of 0.030%), Slovak (12.2%, a difference of 0.040%), Mexican (12.2%, a difference of 0.040%), Immigrants from Guatemala (12.2%, a difference of 0.070%), and Portuguese (12.2%, a difference of 0.080%).
| Demographics | Rating | Rank | Divorced or Separated |
| Immigrants | Africa | 30.3 /100 | #197 | Fair 12.1% |
| Nigerians | 30.1 /100 | #198 | Fair 12.1% |
| Central Americans | 29.4 /100 | #199 | Fair 12.1% |
| South Americans | 28.6 /100 | #200 | Fair 12.2% |
| Guatemalans | 26.9 /100 | #201 | Fair 12.2% |
| Portuguese | 23.5 /100 | #202 | Fair 12.2% |
| Immigrants | Guatemala | 23.2 /100 | #203 | Fair 12.2% |
| Kenyans | 21.8 /100 | #204 | Fair 12.2% |
| Immigrants | Costa Rica | 21.3 /100 | #205 | Fair 12.2% |
| Slovaks | 21.0 /100 | #206 | Fair 12.2% |
| Mexicans | 21.0 /100 | #207 | Fair 12.2% |
| Immigrants | Ghana | 18.8 /100 | #208 | Poor 12.2% |
| Immigrants | Trinidad and Tobago | 17.8 /100 | #209 | Poor 12.2% |
| Slavs | 17.0 /100 | #210 | Poor 12.2% |
| Trinidadians and Tobagonians | 16.6 /100 | #211 | Poor 12.2% |