Bhutanese vs Immigrants from Germany Divorced or Separated
COMPARE
Bhutanese
Immigrants from Germany
Divorced or Separated
Divorced or Separated Comparison
Bhutanese
Immigrants from Germany
11.2%
DIVORCED OR SEPARATED
100.0/ 100
METRIC RATING
41st/ 347
METRIC RANK
12.4%
DIVORCED OR SEPARATED
4.0/ 100
METRIC RATING
239th/ 347
METRIC RANK
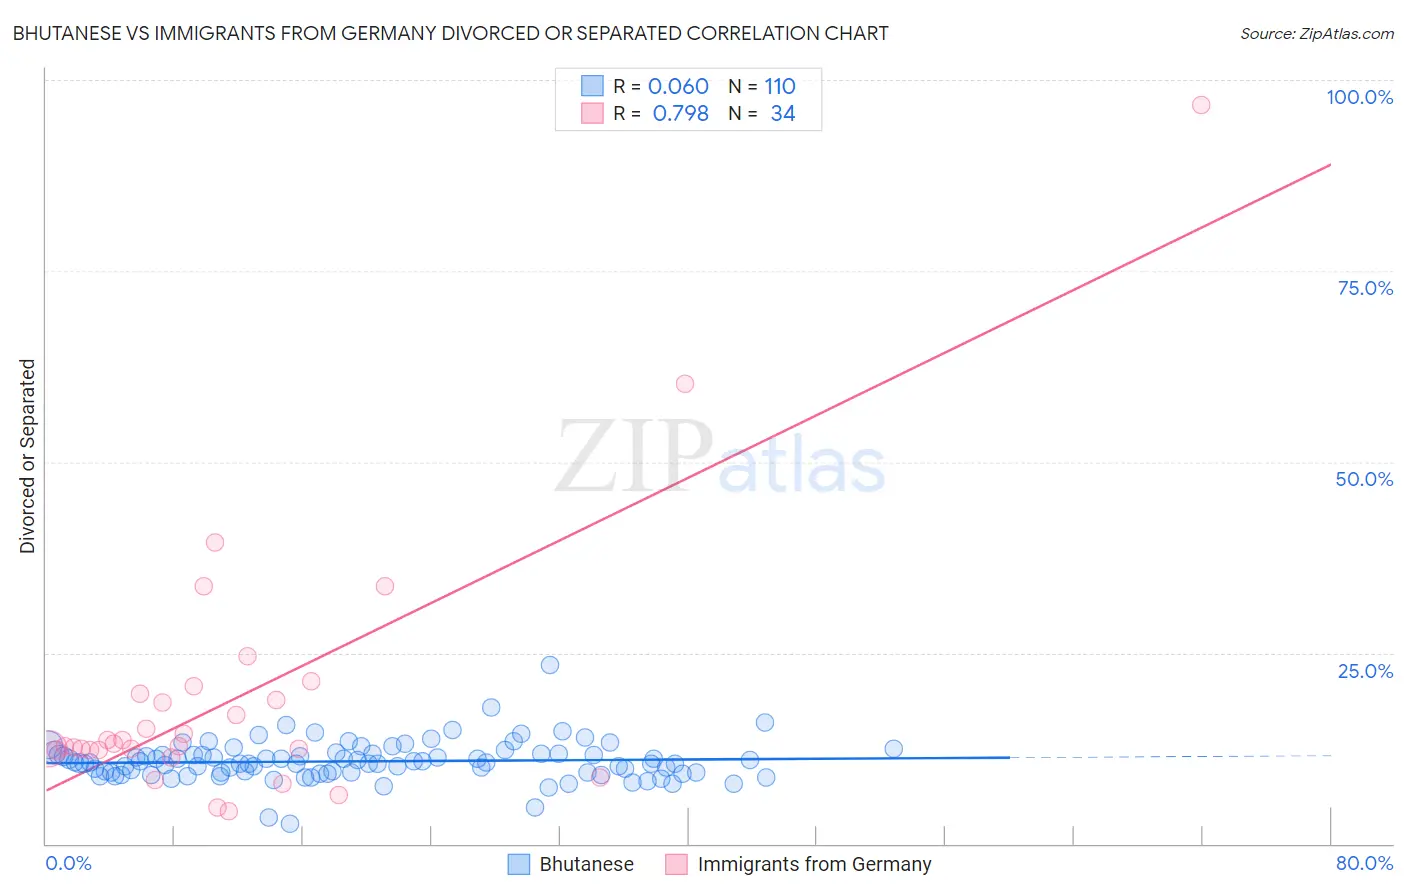
Bhutanese vs Immigrants from Germany Divorced or Separated Correlation Chart
The statistical analysis conducted on geographies consisting of 455,285,816 people shows a slight positive correlation between the proportion of Bhutanese and percentage of population currently divorced or separated in the United States with a correlation coefficient (R) of 0.060 and weighted average of 11.2%. Similarly, the statistical analysis conducted on geographies consisting of 463,791,501 people shows a strong positive correlation between the proportion of Immigrants from Germany and percentage of population currently divorced or separated in the United States with a correlation coefficient (R) of 0.798 and weighted average of 12.4%, a difference of 10.8%.
Divorced or Separated Correlation Summary
| Measurement | Bhutanese | Immigrants from Germany |
| Minimum | 2.7% | 4.2% |
| Maximum | 23.4% | 96.8% |
| Range | 20.7% | 92.6% |
| Mean | 10.8% | 19.1% |
| Median | 10.6% | 13.0% |
| Interquartile 25% (IQ1) | 9.3% | 12.3% |
| Interquartile 75% (IQ3) | 11.8% | 19.6% |
| Interquartile Range (IQR) | 2.5% | 7.3% |
| Standard Deviation (Sample) | 2.6% | 17.6% |
| Standard Deviation (Population) | 2.6% | 17.3% |
Similar Demographics by Divorced or Separated
Demographics Similar to Bhutanese by Divorced or Separated
In terms of divorced or separated, the demographic groups most similar to Bhutanese are Chinese (11.2%, a difference of 0.060%), Immigrants from Belarus (11.2%, a difference of 0.070%), Immigrants from Western Asia (11.2%, a difference of 0.090%), Turkish (11.2%, a difference of 0.13%), and Laotian (11.2%, a difference of 0.24%).
| Demographics | Rating | Rank | Divorced or Separated |
| Immigrants | Uzbekistan | 100.0 /100 | #34 | Exceptional 11.1% |
| Cambodians | 100.0 /100 | #35 | Exceptional 11.1% |
| Immigrants | Japan | 100.0 /100 | #36 | Exceptional 11.1% |
| Immigrants | Lebanon | 100.0 /100 | #37 | Exceptional 11.1% |
| Immigrants | Greece | 100.0 /100 | #38 | Exceptional 11.1% |
| Immigrants | Egypt | 100.0 /100 | #39 | Exceptional 11.1% |
| Soviet Union | 100.0 /100 | #40 | Exceptional 11.1% |
| Bhutanese | 100.0 /100 | #41 | Exceptional 11.2% |
| Chinese | 100.0 /100 | #42 | Exceptional 11.2% |
| Immigrants | Belarus | 100.0 /100 | #43 | Exceptional 11.2% |
| Immigrants | Western Asia | 100.0 /100 | #44 | Exceptional 11.2% |
| Turks | 100.0 /100 | #45 | Exceptional 11.2% |
| Laotians | 100.0 /100 | #46 | Exceptional 11.2% |
| Immigrants | Poland | 100.0 /100 | #47 | Exceptional 11.2% |
| Immigrants | Turkey | 100.0 /100 | #48 | Exceptional 11.2% |
Demographics Similar to Immigrants from Germany by Divorced or Separated
In terms of divorced or separated, the demographic groups most similar to Immigrants from Germany are Sudanese (12.4%, a difference of 0.010%), Colombian (12.4%, a difference of 0.040%), Immigrants from Laos (12.4%, a difference of 0.040%), British West Indian (12.4%, a difference of 0.050%), and Immigrants from Bosnia and Herzegovina (12.4%, a difference of 0.070%).
| Demographics | Rating | Rank | Divorced or Separated |
| Canadians | 5.3 /100 | #232 | Tragic 12.4% |
| Malaysians | 4.8 /100 | #233 | Tragic 12.4% |
| West Indians | 4.4 /100 | #234 | Tragic 12.4% |
| Immigrants | Bosnia and Herzegovina | 4.3 /100 | #235 | Tragic 12.4% |
| Colombians | 4.2 /100 | #236 | Tragic 12.4% |
| Immigrants | Laos | 4.2 /100 | #237 | Tragic 12.4% |
| Sudanese | 4.0 /100 | #238 | Tragic 12.4% |
| Immigrants | Germany | 4.0 /100 | #239 | Tragic 12.4% |
| British West Indians | 3.7 /100 | #240 | Tragic 12.4% |
| Uruguayans | 3.4 /100 | #241 | Tragic 12.4% |
| Dutch | 3.1 /100 | #242 | Tragic 12.4% |
| Immigrants | Latin America | 2.8 /100 | #243 | Tragic 12.4% |
| Alaska Natives | 2.5 /100 | #244 | Tragic 12.4% |
| Hispanics or Latinos | 2.0 /100 | #245 | Tragic 12.5% |
| Immigrants | West Indies | 1.9 /100 | #246 | Tragic 12.5% |