Bhutanese vs Russian Divorced or Separated
COMPARE
Bhutanese
Russian
Divorced or Separated
Divorced or Separated Comparison
Bhutanese
Russians
11.2%
DIVORCED OR SEPARATED
100.0/ 100
METRIC RATING
41st/ 347
METRIC RANK
11.5%
DIVORCED OR SEPARATED
99.4/ 100
METRIC RATING
81st/ 347
METRIC RANK
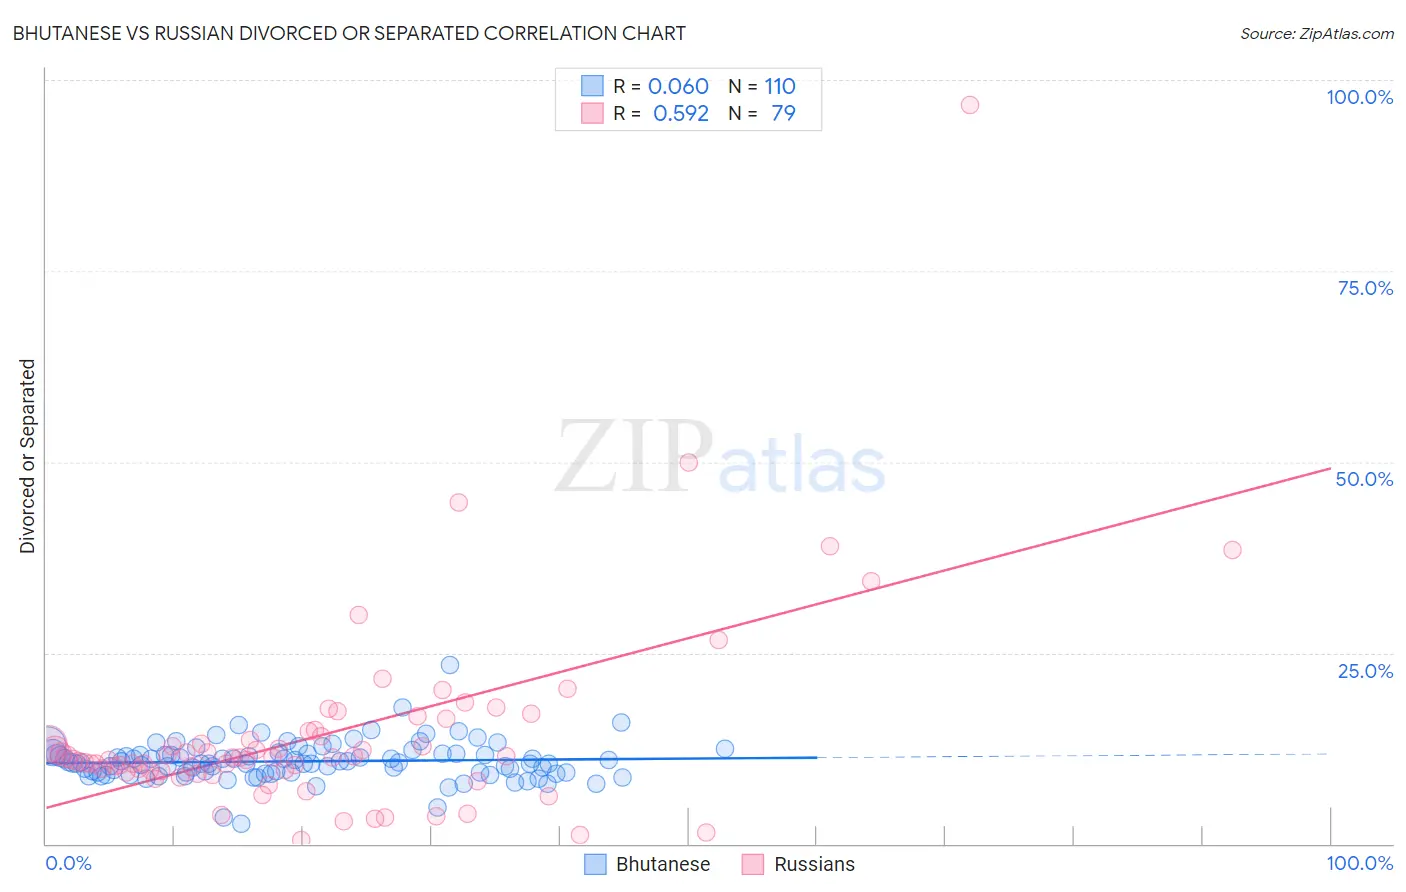
Bhutanese vs Russian Divorced or Separated Correlation Chart
The statistical analysis conducted on geographies consisting of 455,285,816 people shows a slight positive correlation between the proportion of Bhutanese and percentage of population currently divorced or separated in the United States with a correlation coefficient (R) of 0.060 and weighted average of 11.2%. Similarly, the statistical analysis conducted on geographies consisting of 511,901,777 people shows a substantial positive correlation between the proportion of Russians and percentage of population currently divorced or separated in the United States with a correlation coefficient (R) of 0.592 and weighted average of 11.5%, a difference of 3.1%.
Divorced or Separated Correlation Summary
| Measurement | Bhutanese | Russian |
| Minimum | 2.7% | 0.50% |
| Maximum | 23.4% | 96.8% |
| Range | 20.7% | 96.3% |
| Mean | 10.8% | 14.3% |
| Median | 10.6% | 11.3% |
| Interquartile 25% (IQ1) | 9.3% | 9.6% |
| Interquartile 75% (IQ3) | 11.8% | 14.8% |
| Interquartile Range (IQR) | 2.5% | 5.2% |
| Standard Deviation (Sample) | 2.6% | 13.0% |
| Standard Deviation (Population) | 2.6% | 12.9% |
Similar Demographics by Divorced or Separated
Demographics Similar to Bhutanese by Divorced or Separated
In terms of divorced or separated, the demographic groups most similar to Bhutanese are Chinese (11.2%, a difference of 0.060%), Immigrants from Belarus (11.2%, a difference of 0.070%), Immigrants from Western Asia (11.2%, a difference of 0.090%), Turkish (11.2%, a difference of 0.13%), and Laotian (11.2%, a difference of 0.24%).
| Demographics | Rating | Rank | Divorced or Separated |
| Immigrants | Uzbekistan | 100.0 /100 | #34 | Exceptional 11.1% |
| Cambodians | 100.0 /100 | #35 | Exceptional 11.1% |
| Immigrants | Japan | 100.0 /100 | #36 | Exceptional 11.1% |
| Immigrants | Lebanon | 100.0 /100 | #37 | Exceptional 11.1% |
| Immigrants | Greece | 100.0 /100 | #38 | Exceptional 11.1% |
| Immigrants | Egypt | 100.0 /100 | #39 | Exceptional 11.1% |
| Soviet Union | 100.0 /100 | #40 | Exceptional 11.1% |
| Bhutanese | 100.0 /100 | #41 | Exceptional 11.2% |
| Chinese | 100.0 /100 | #42 | Exceptional 11.2% |
| Immigrants | Belarus | 100.0 /100 | #43 | Exceptional 11.2% |
| Immigrants | Western Asia | 100.0 /100 | #44 | Exceptional 11.2% |
| Turks | 100.0 /100 | #45 | Exceptional 11.2% |
| Laotians | 100.0 /100 | #46 | Exceptional 11.2% |
| Immigrants | Poland | 100.0 /100 | #47 | Exceptional 11.2% |
| Immigrants | Turkey | 100.0 /100 | #48 | Exceptional 11.2% |
Demographics Similar to Russians by Divorced or Separated
In terms of divorced or separated, the demographic groups most similar to Russians are Immigrants from Switzerland (11.5%, a difference of 0.010%), Guyanese (11.5%, a difference of 0.030%), Afghan (11.5%, a difference of 0.070%), Immigrants from Romania (11.5%, a difference of 0.080%), and Immigrants from Bulgaria (11.5%, a difference of 0.11%).
| Demographics | Rating | Rank | Divorced or Separated |
| Taiwanese | 99.6 /100 | #74 | Exceptional 11.5% |
| Immigrants | Northern Africa | 99.6 /100 | #75 | Exceptional 11.5% |
| Albanians | 99.6 /100 | #76 | Exceptional 11.5% |
| Immigrants | Italy | 99.5 /100 | #77 | Exceptional 11.5% |
| Afghans | 99.4 /100 | #78 | Exceptional 11.5% |
| Guyanese | 99.4 /100 | #79 | Exceptional 11.5% |
| Immigrants | Switzerland | 99.4 /100 | #80 | Exceptional 11.5% |
| Russians | 99.4 /100 | #81 | Exceptional 11.5% |
| Immigrants | Romania | 99.3 /100 | #82 | Exceptional 11.5% |
| Immigrants | Bulgaria | 99.3 /100 | #83 | Exceptional 11.5% |
| Bulgarians | 99.3 /100 | #84 | Exceptional 11.5% |
| Immigrants | Albania | 99.3 /100 | #85 | Exceptional 11.5% |
| Immigrants | Latvia | 99.2 /100 | #86 | Exceptional 11.6% |
| Immigrants | Nepal | 99.2 /100 | #87 | Exceptional 11.6% |
| Immigrants | Europe | 99.2 /100 | #88 | Exceptional 11.6% |