Croatian vs Kenyan Divorced or Separated
COMPARE
Croatian
Kenyan
Divorced or Separated
Divorced or Separated Comparison
Croatians
Kenyans
11.9%
DIVORCED OR SEPARATED
80.6/ 100
METRIC RATING
145th/ 347
METRIC RANK
12.2%
DIVORCED OR SEPARATED
21.8/ 100
METRIC RATING
204th/ 347
METRIC RANK
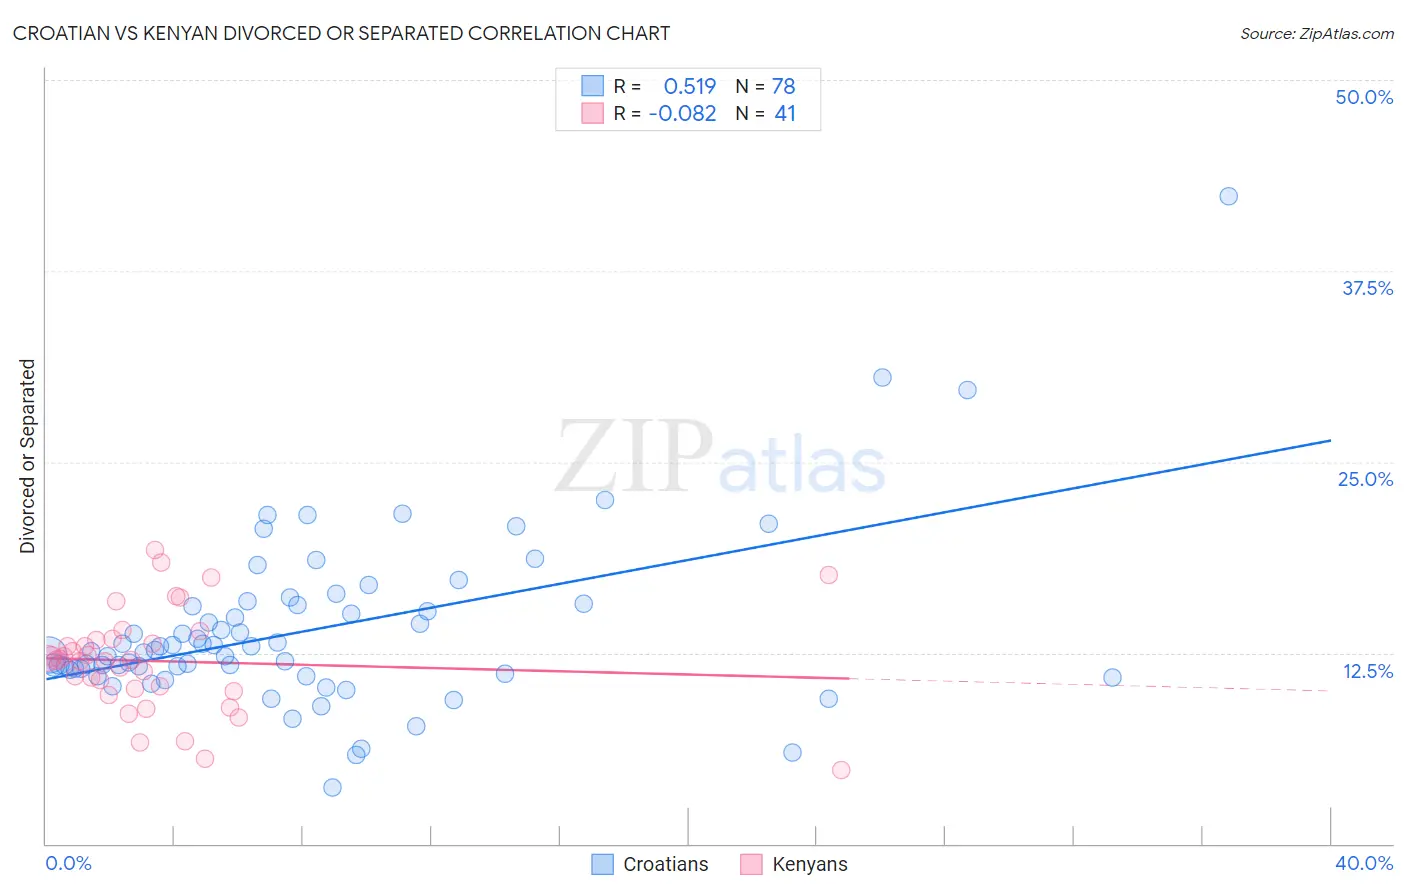
Croatian vs Kenyan Divorced or Separated Correlation Chart
The statistical analysis conducted on geographies consisting of 375,586,631 people shows a substantial positive correlation between the proportion of Croatians and percentage of population currently divorced or separated in the United States with a correlation coefficient (R) of 0.519 and weighted average of 11.9%. Similarly, the statistical analysis conducted on geographies consisting of 168,184,895 people shows a slight negative correlation between the proportion of Kenyans and percentage of population currently divorced or separated in the United States with a correlation coefficient (R) of -0.082 and weighted average of 12.2%, a difference of 2.4%.
Divorced or Separated Correlation Summary
| Measurement | Croatian | Kenyan |
| Minimum | 3.7% | 4.8% |
| Maximum | 42.4% | 19.2% |
| Range | 38.7% | 14.4% |
| Mean | 14.0% | 11.9% |
| Median | 12.6% | 12.0% |
| Interquartile 25% (IQ1) | 11.4% | 10.1% |
| Interquartile 75% (IQ3) | 15.6% | 13.4% |
| Interquartile Range (IQR) | 4.2% | 3.3% |
| Standard Deviation (Sample) | 5.7% | 3.3% |
| Standard Deviation (Population) | 5.6% | 3.3% |
Similar Demographics by Divorced or Separated
Demographics Similar to Croatians by Divorced or Separated
In terms of divorced or separated, the demographic groups most similar to Croatians are Peruvian (11.9%, a difference of 0.020%), Immigrants from Zimbabwe (11.9%, a difference of 0.050%), Pakistani (11.9%, a difference of 0.050%), Immigrants from Grenada (11.9%, a difference of 0.080%), and Polish (11.9%, a difference of 0.11%).
| Demographics | Rating | Rank | Divorced or Separated |
| Immigrants | Netherlands | 83.9 /100 | #138 | Excellent 11.9% |
| Australians | 83.6 /100 | #139 | Excellent 11.9% |
| Lebanese | 83.4 /100 | #140 | Excellent 11.9% |
| Immigrants | Morocco | 82.9 /100 | #141 | Excellent 11.9% |
| Immigrants | Zimbabwe | 81.5 /100 | #142 | Excellent 11.9% |
| Pakistanis | 81.3 /100 | #143 | Excellent 11.9% |
| Peruvians | 80.9 /100 | #144 | Excellent 11.9% |
| Croatians | 80.6 /100 | #145 | Excellent 11.9% |
| Immigrants | Grenada | 79.1 /100 | #146 | Good 11.9% |
| Poles | 78.6 /100 | #147 | Good 11.9% |
| Italians | 77.8 /100 | #148 | Good 11.9% |
| Immigrants | Oceania | 77.7 /100 | #149 | Good 11.9% |
| Immigrants | Portugal | 77.3 /100 | #150 | Good 11.9% |
| Czechs | 76.4 /100 | #151 | Good 11.9% |
| Immigrants | Hungary | 73.7 /100 | #152 | Good 11.9% |
Demographics Similar to Kenyans by Divorced or Separated
In terms of divorced or separated, the demographic groups most similar to Kenyans are Immigrants from Costa Rica (12.2%, a difference of 0.030%), Slovak (12.2%, a difference of 0.040%), Mexican (12.2%, a difference of 0.040%), Immigrants from Guatemala (12.2%, a difference of 0.070%), and Portuguese (12.2%, a difference of 0.080%).
| Demographics | Rating | Rank | Divorced or Separated |
| Immigrants | Africa | 30.3 /100 | #197 | Fair 12.1% |
| Nigerians | 30.1 /100 | #198 | Fair 12.1% |
| Central Americans | 29.4 /100 | #199 | Fair 12.1% |
| South Americans | 28.6 /100 | #200 | Fair 12.2% |
| Guatemalans | 26.9 /100 | #201 | Fair 12.2% |
| Portuguese | 23.5 /100 | #202 | Fair 12.2% |
| Immigrants | Guatemala | 23.2 /100 | #203 | Fair 12.2% |
| Kenyans | 21.8 /100 | #204 | Fair 12.2% |
| Immigrants | Costa Rica | 21.3 /100 | #205 | Fair 12.2% |
| Slovaks | 21.0 /100 | #206 | Fair 12.2% |
| Mexicans | 21.0 /100 | #207 | Fair 12.2% |
| Immigrants | Ghana | 18.8 /100 | #208 | Poor 12.2% |
| Immigrants | Trinidad and Tobago | 17.8 /100 | #209 | Poor 12.2% |
| Slavs | 17.0 /100 | #210 | Poor 12.2% |
| Trinidadians and Tobagonians | 16.6 /100 | #211 | Poor 12.2% |