Immigrants from Honduras vs Kenyan Divorced or Separated
COMPARE
Immigrants from Honduras
Kenyan
Divorced or Separated
Divorced or Separated Comparison
Immigrants from Honduras
Kenyans
12.9%
DIVORCED OR SEPARATED
0.0/ 100
METRIC RATING
291st/ 347
METRIC RANK
12.2%
DIVORCED OR SEPARATED
21.8/ 100
METRIC RATING
204th/ 347
METRIC RANK
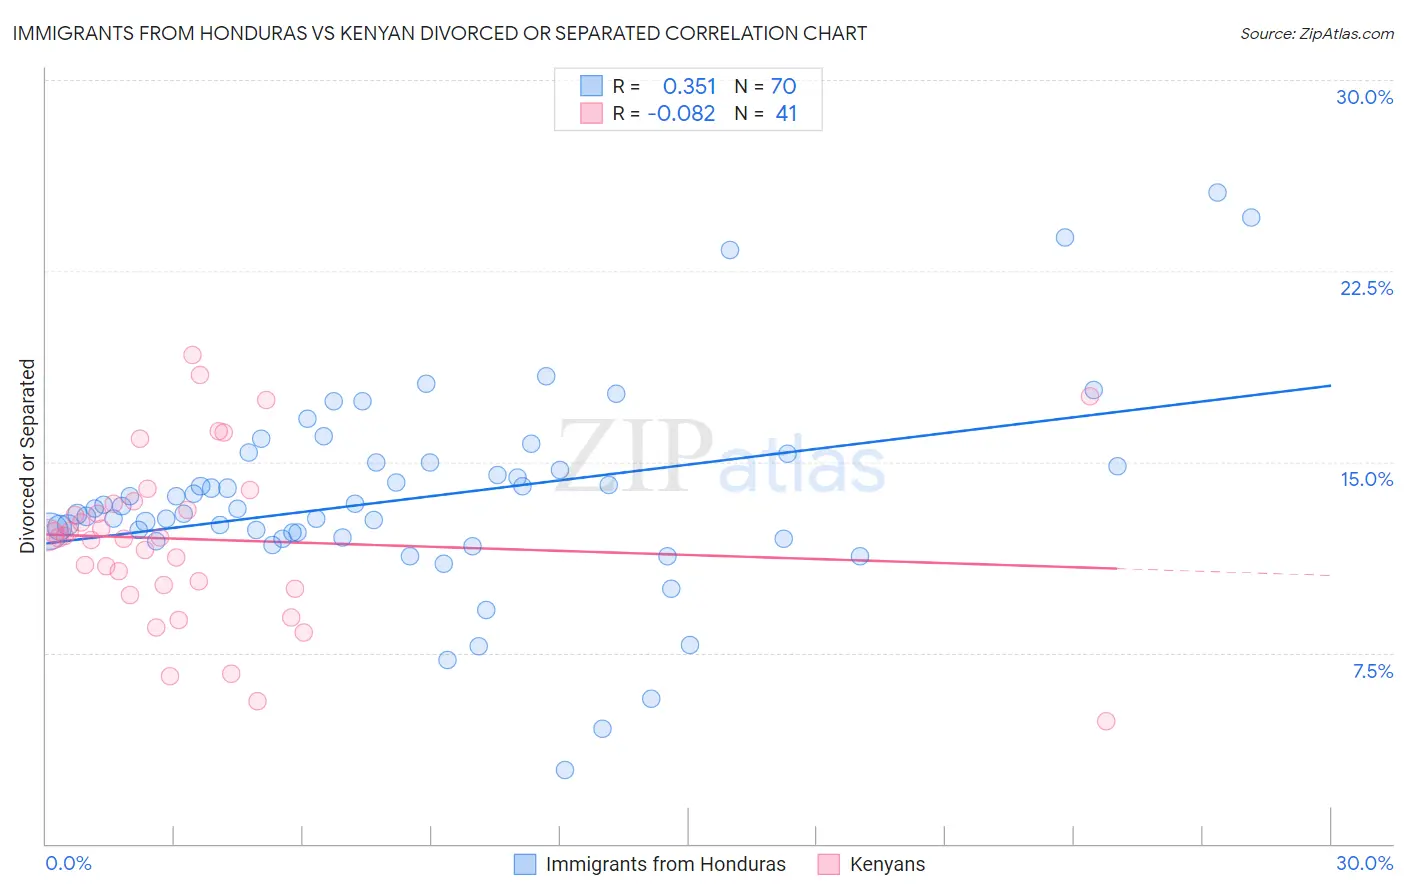
Immigrants from Honduras vs Kenyan Divorced or Separated Correlation Chart
The statistical analysis conducted on geographies consisting of 322,564,867 people shows a mild positive correlation between the proportion of Immigrants from Honduras and percentage of population currently divorced or separated in the United States with a correlation coefficient (R) of 0.351 and weighted average of 12.9%. Similarly, the statistical analysis conducted on geographies consisting of 168,184,895 people shows a slight negative correlation between the proportion of Kenyans and percentage of population currently divorced or separated in the United States with a correlation coefficient (R) of -0.082 and weighted average of 12.2%, a difference of 5.8%.
Divorced or Separated Correlation Summary
| Measurement | Immigrants from Honduras | Kenyan |
| Minimum | 2.9% | 4.8% |
| Maximum | 25.6% | 19.2% |
| Range | 22.7% | 14.4% |
| Mean | 13.6% | 11.9% |
| Median | 13.2% | 12.0% |
| Interquartile 25% (IQ1) | 12.0% | 10.1% |
| Interquartile 75% (IQ3) | 15.0% | 13.4% |
| Interquartile Range (IQR) | 2.9% | 3.3% |
| Standard Deviation (Sample) | 3.9% | 3.3% |
| Standard Deviation (Population) | 3.9% | 3.3% |
Similar Demographics by Divorced or Separated
Demographics Similar to Immigrants from Honduras by Divorced or Separated
In terms of divorced or separated, the demographic groups most similar to Immigrants from Honduras are Scotch-Irish (12.9%, a difference of 0.060%), Pima (12.9%, a difference of 0.12%), Iroquois (12.9%, a difference of 0.26%), Jamaican (12.9%, a difference of 0.27%), and Apache (12.9%, a difference of 0.30%).
| Demographics | Rating | Rank | Divorced or Separated |
| Immigrants | Nonimmigrants | 0.1 /100 | #284 | Tragic 12.8% |
| French | 0.1 /100 | #285 | Tragic 12.8% |
| Spanish | 0.1 /100 | #286 | Tragic 12.8% |
| Hondurans | 0.1 /100 | #287 | Tragic 12.8% |
| French Canadians | 0.1 /100 | #288 | Tragic 12.8% |
| Iroquois | 0.0 /100 | #289 | Tragic 12.9% |
| Pima | 0.0 /100 | #290 | Tragic 12.9% |
| Immigrants | Honduras | 0.0 /100 | #291 | Tragic 12.9% |
| Scotch-Irish | 0.0 /100 | #292 | Tragic 12.9% |
| Jamaicans | 0.0 /100 | #293 | Tragic 12.9% |
| Apache | 0.0 /100 | #294 | Tragic 12.9% |
| Celtics | 0.0 /100 | #295 | Tragic 13.0% |
| Nicaraguans | 0.0 /100 | #296 | Tragic 13.0% |
| Natives/Alaskans | 0.0 /100 | #297 | Tragic 13.0% |
| Venezuelans | 0.0 /100 | #298 | Tragic 13.0% |
Demographics Similar to Kenyans by Divorced or Separated
In terms of divorced or separated, the demographic groups most similar to Kenyans are Immigrants from Costa Rica (12.2%, a difference of 0.030%), Slovak (12.2%, a difference of 0.040%), Mexican (12.2%, a difference of 0.040%), Immigrants from Guatemala (12.2%, a difference of 0.070%), and Portuguese (12.2%, a difference of 0.080%).
| Demographics | Rating | Rank | Divorced or Separated |
| Immigrants | Africa | 30.3 /100 | #197 | Fair 12.1% |
| Nigerians | 30.1 /100 | #198 | Fair 12.1% |
| Central Americans | 29.4 /100 | #199 | Fair 12.1% |
| South Americans | 28.6 /100 | #200 | Fair 12.2% |
| Guatemalans | 26.9 /100 | #201 | Fair 12.2% |
| Portuguese | 23.5 /100 | #202 | Fair 12.2% |
| Immigrants | Guatemala | 23.2 /100 | #203 | Fair 12.2% |
| Kenyans | 21.8 /100 | #204 | Fair 12.2% |
| Immigrants | Costa Rica | 21.3 /100 | #205 | Fair 12.2% |
| Slovaks | 21.0 /100 | #206 | Fair 12.2% |
| Mexicans | 21.0 /100 | #207 | Fair 12.2% |
| Immigrants | Ghana | 18.8 /100 | #208 | Poor 12.2% |
| Immigrants | Trinidad and Tobago | 17.8 /100 | #209 | Poor 12.2% |
| Slavs | 17.0 /100 | #210 | Poor 12.2% |
| Trinidadians and Tobagonians | 16.6 /100 | #211 | Poor 12.2% |