Bhutanese vs Immigrants from Denmark Divorced or Separated
COMPARE
Bhutanese
Immigrants from Denmark
Divorced or Separated
Divorced or Separated Comparison
Bhutanese
Immigrants from Denmark
11.2%
DIVORCED OR SEPARATED
100.0/ 100
METRIC RATING
41st/ 347
METRIC RANK
11.6%
DIVORCED OR SEPARATED
98.9/ 100
METRIC RATING
92nd/ 347
METRIC RANK
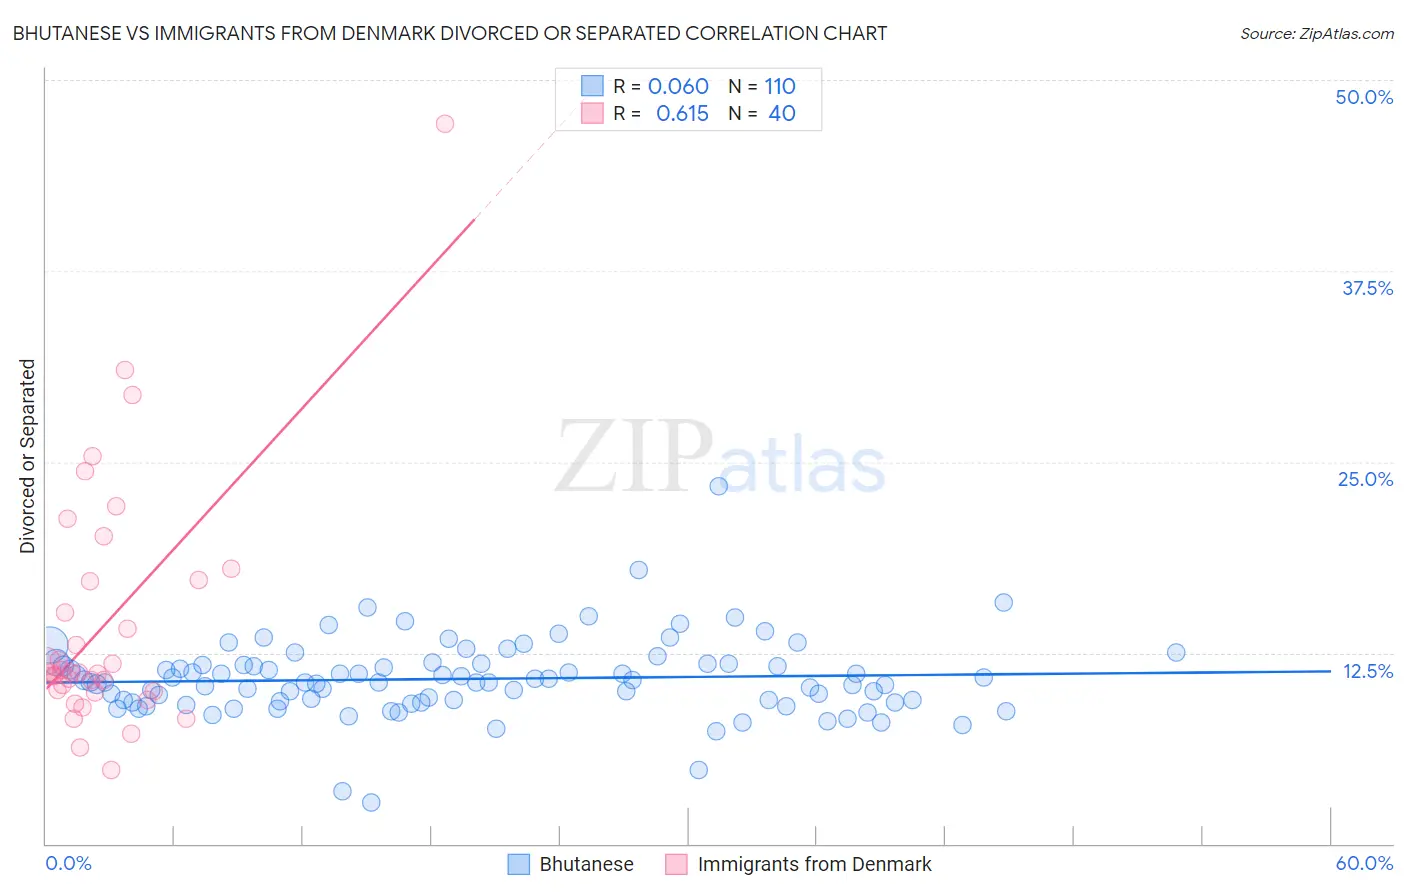
Bhutanese vs Immigrants from Denmark Divorced or Separated Correlation Chart
The statistical analysis conducted on geographies consisting of 455,285,816 people shows a slight positive correlation between the proportion of Bhutanese and percentage of population currently divorced or separated in the United States with a correlation coefficient (R) of 0.060 and weighted average of 11.2%. Similarly, the statistical analysis conducted on geographies consisting of 136,412,843 people shows a significant positive correlation between the proportion of Immigrants from Denmark and percentage of population currently divorced or separated in the United States with a correlation coefficient (R) of 0.615 and weighted average of 11.6%, a difference of 3.6%.
Divorced or Separated Correlation Summary
| Measurement | Bhutanese | Immigrants from Denmark |
| Minimum | 2.7% | 4.8% |
| Maximum | 23.4% | 47.1% |
| Range | 20.7% | 42.3% |
| Mean | 10.8% | 14.4% |
| Median | 10.6% | 11.2% |
| Interquartile 25% (IQ1) | 9.3% | 10.0% |
| Interquartile 75% (IQ3) | 11.8% | 17.2% |
| Interquartile Range (IQR) | 2.5% | 7.2% |
| Standard Deviation (Sample) | 2.6% | 8.1% |
| Standard Deviation (Population) | 2.6% | 8.0% |
Similar Demographics by Divorced or Separated
Demographics Similar to Bhutanese by Divorced or Separated
In terms of divorced or separated, the demographic groups most similar to Bhutanese are Chinese (11.2%, a difference of 0.060%), Immigrants from Belarus (11.2%, a difference of 0.070%), Immigrants from Western Asia (11.2%, a difference of 0.090%), Turkish (11.2%, a difference of 0.13%), and Laotian (11.2%, a difference of 0.24%).
| Demographics | Rating | Rank | Divorced or Separated |
| Immigrants | Uzbekistan | 100.0 /100 | #34 | Exceptional 11.1% |
| Cambodians | 100.0 /100 | #35 | Exceptional 11.1% |
| Immigrants | Japan | 100.0 /100 | #36 | Exceptional 11.1% |
| Immigrants | Lebanon | 100.0 /100 | #37 | Exceptional 11.1% |
| Immigrants | Greece | 100.0 /100 | #38 | Exceptional 11.1% |
| Immigrants | Egypt | 100.0 /100 | #39 | Exceptional 11.1% |
| Soviet Union | 100.0 /100 | #40 | Exceptional 11.1% |
| Bhutanese | 100.0 /100 | #41 | Exceptional 11.2% |
| Chinese | 100.0 /100 | #42 | Exceptional 11.2% |
| Immigrants | Belarus | 100.0 /100 | #43 | Exceptional 11.2% |
| Immigrants | Western Asia | 100.0 /100 | #44 | Exceptional 11.2% |
| Turks | 100.0 /100 | #45 | Exceptional 11.2% |
| Laotians | 100.0 /100 | #46 | Exceptional 11.2% |
| Immigrants | Poland | 100.0 /100 | #47 | Exceptional 11.2% |
| Immigrants | Turkey | 100.0 /100 | #48 | Exceptional 11.2% |
Demographics Similar to Immigrants from Denmark by Divorced or Separated
In terms of divorced or separated, the demographic groups most similar to Immigrants from Denmark are Arab (11.6%, a difference of 0.0%), Immigrants from Fiji (11.6%, a difference of 0.010%), Spanish American Indian (11.6%, a difference of 0.060%), Zimbabwean (11.6%, a difference of 0.10%), and Immigrants from Serbia (11.6%, a difference of 0.11%).
| Demographics | Rating | Rank | Divorced or Separated |
| Immigrants | Albania | 99.3 /100 | #85 | Exceptional 11.5% |
| Immigrants | Latvia | 99.2 /100 | #86 | Exceptional 11.6% |
| Immigrants | Nepal | 99.2 /100 | #87 | Exceptional 11.6% |
| Immigrants | Europe | 99.2 /100 | #88 | Exceptional 11.6% |
| Immigrants | Southern Europe | 99.1 /100 | #89 | Exceptional 11.6% |
| Zimbabweans | 99.0 /100 | #90 | Exceptional 11.6% |
| Spanish American Indians | 99.0 /100 | #91 | Exceptional 11.6% |
| Immigrants | Denmark | 98.9 /100 | #92 | Exceptional 11.6% |
| Arabs | 98.9 /100 | #93 | Exceptional 11.6% |
| Immigrants | Fiji | 98.9 /100 | #94 | Exceptional 11.6% |
| Immigrants | Serbia | 98.8 /100 | #95 | Exceptional 11.6% |
| Immigrants | Ukraine | 98.7 /100 | #96 | Exceptional 11.6% |
| Latvians | 98.7 /100 | #97 | Exceptional 11.6% |
| Immigrants | Jordan | 98.6 /100 | #98 | Exceptional 11.6% |
| Immigrants | Sweden | 98.6 /100 | #99 | Exceptional 11.6% |