Bhutanese vs Icelander Divorced or Separated

COMPARE

Bhutanese
Race
Ancestry
AfghanAfricanAlaska NativeAlaskan AthabascanAlbanianAleutAlsatianAmericanApacheArabArapahoArgentineanArmenianAssyrian/Chaldean/SyriacAustralianAustrianBahamianBangladeshiBarbadianBasqueBelgianBelizeanBermudanBhutaneseBlackfeetBolivianBrazilianBritishBritish West IndianBulgarianBurmeseCajunCambodianCanadianCape VerdeanCarpatho RusynCelticCentral AmericanCentral American IndianCherokeeCheyenneChickasawChileanChineseChippewaChoctawColombianColvilleComancheCosta RicanCreeCreekCroatianCrowCubanCypriotCzechCzechoslovakianDanishDelawareDominicanDutchDutch West IndianEastern EuropeanEcuadorianEgyptianEnglishEstonianEthiopianEuropeanFijianFilipinoFinnishFrenchFrench American IndianFrench CanadianGermanGerman RussianGhanaianGreekGuamanian/ChamorroGuatemalanGuyaneseHaitianHmongHonduranHopiHoumaHungarianIndian (Asian)IndonesianInupiatIranianIraqiIrishIroquoisIsraeliItalianJamaicanJapaneseJordanianKenyanKiowaKoreanLaotianLatvianLebaneseLiberianLithuanianLumbeeLuxembourgerMacedonianMalaysianMalteseMarshalleseMenomineeMexicanMexican American IndianMongolianMoroccanNative HawaiianNavajoNepaleseNew ZealanderNicaraguanNigerianNorthern EuropeanNorwegianOkinawanOsageOttawaPaiutePakistaniPalestinianPanamanianParaguayanPennsylvania GermanPeruvianPimaPolishPortuguesePotawatomiPuebloPuerto RicanPuget Sound SalishRomanianRussianSalvadoranSamoanScandinavianScotch-IrishScottishSeminoleSenegaleseSerbianShoshoneSierra LeoneanSiouxSlavicSlovakSloveneSomaliSouth AfricanSouth AmericanSouth American IndianSoviet UnionSpaniardSpanishSpanish AmericanSpanish American IndianSri LankanSubsaharan AfricanSudaneseSwedishSwissSyrianTaiwaneseThaiTlingit-HaidaTohono O'OdhamTonganTrinidadian and TobagonianTsimshianTurkishU.S. Virgin IslanderUgandanUkrainianUruguayanUteVenezuelanVietnameseWelshWest IndianYakamaYaquiYugoslavianYumanYup'ikZimbabwean
Immigration
NonimmigrantsImmigrantsAfghanistanAfricaAlbaniaArgentinaArmeniaAsiaAustraliaAustriaBahamasBangladeshBarbadosBelarusBelgiumBelizeBoliviaBosnia and HerzegovinaBrazilBulgariaBurma/MyanmarCabo VerdeCambodiaCameroonCanadaCaribbeanCentral AmericaChileChinaColombiaCongoCosta RicaCroatiaCubaCzechoslovakiaDenmarkDominicaDominican RepublicEastern AfricaEastern AsiaEastern EuropeEcuadorEgyptEl SalvadorEnglandEritreaEthiopiaEuropeFijiFranceGermanyGhanaGreeceGrenadaGuatemalaGuyanaHaitiHondurasHong KongHungaryIndiaIndonesiaIranIraqIrelandIsraelItalyJamaicaJapanJordanKazakhstanKenyaKoreaKuwaitLaosLatin AmericaLatviaLebanonLiberiaLithuaniaMalaysiaMexicoMicronesiaMiddle AfricaMoldovaMoroccoNepalNetherlandsNicaraguaNigeriaNorth AmericaNorth MacedoniaNorthern AfricaNorthern EuropeNorwayOceaniaPakistanPanamaPeruPhilippinesPolandPortugalRomaniaRussiaSaudi ArabiaScotlandSenegalSerbiaSierra LeoneSingaporeSomaliaSouth AfricaSouth AmericaSouth Central AsiaSouth Eastern AsiaSouthern EuropeSpainSri LankaSt. Vincent and the GrenadinesSudanSwedenSwitzerlandSyriaTaiwanThailandTrinidad and TobagoTurkeyUgandaUkraineUruguayUzbekistanVenezuelaVietnamWest IndiesWestern AfricaWestern AsiaWestern EuropeYemenZaireZimbabweAzores
Icelander
Race
Ancestry
AfghanAfricanAlaska NativeAlaskan AthabascanAlbanianAleutAlsatianAmericanApacheArabArapahoArgentineanArmenianAssyrian/Chaldean/SyriacAustralianAustrianBahamianBangladeshiBarbadianBasqueBelgianBelizeanBermudanBlackfeetBolivianBrazilianBritishBritish West IndianBulgarianBurmeseCajunCambodianCanadianCape VerdeanCarpatho RusynCelticCentral AmericanCentral American IndianCherokeeCheyenneChickasawChileanChineseChippewaChoctawColombianColvilleComancheCosta RicanCreeCreekCroatianCrowCubanCypriotCzechCzechoslovakianDanishDelawareDominicanDutchDutch West IndianEastern EuropeanEcuadorianEgyptianEnglishEstonianEthiopianEuropeanFijianFilipinoFinnishFrenchFrench American IndianFrench CanadianGermanGerman RussianGhanaianGreekGuamanian/ChamorroGuatemalanGuyaneseHaitianHmongHonduranHopiHoumaHungarianIcelanderIndian (Asian)IndonesianInupiatIranianIraqiIrishIroquoisIsraeliItalianJamaicanJapaneseJordanianKenyanKiowaKoreanLaotianLatvianLebaneseLiberianLithuanianLumbeeLuxembourgerMacedonianMalaysianMalteseMarshalleseMenomineeMexicanMexican American IndianMongolianMoroccanNative HawaiianNavajoNepaleseNew ZealanderNicaraguanNigerianNorthern EuropeanNorwegianOkinawanOsageOttawaPaiutePakistaniPalestinianPanamanianParaguayanPennsylvania GermanPeruvianPimaPolishPortuguesePotawatomiPuebloPuerto RicanPuget Sound SalishRomanianRussianSalvadoranSamoanScandinavianScotch-IrishScottishSeminoleSenegaleseSerbianShoshoneSierra LeoneanSiouxSlavicSlovakSloveneSomaliSouth AfricanSouth AmericanSouth American IndianSoviet UnionSpaniardSpanishSpanish AmericanSpanish American IndianSri LankanSubsaharan AfricanSudaneseSwedishSwissSyrianTaiwaneseThaiTlingit-HaidaTohono O'OdhamTonganTrinidadian and TobagonianTsimshianTurkishU.S. Virgin IslanderUgandanUkrainianUruguayanUteVenezuelanVietnameseWelshWest IndianYakamaYaquiYugoslavianYumanYup'ikZimbabwean
Immigration
NonimmigrantsImmigrantsAfghanistanAfricaAlbaniaArgentinaArmeniaAsiaAustraliaAustriaBahamasBangladeshBarbadosBelarusBelgiumBelizeBoliviaBosnia and HerzegovinaBrazilBulgariaBurma/MyanmarCabo VerdeCambodiaCameroonCanadaCaribbeanCentral AmericaChileChinaColombiaCongoCosta RicaCroatiaCubaCzechoslovakiaDenmarkDominicaDominican RepublicEastern AfricaEastern AsiaEastern EuropeEcuadorEgyptEl SalvadorEnglandEritreaEthiopiaEuropeFijiFranceGermanyGhanaGreeceGrenadaGuatemalaGuyanaHaitiHondurasHong KongHungaryIndiaIndonesiaIranIraqIrelandIsraelItalyJamaicaJapanJordanKazakhstanKenyaKoreaKuwaitLaosLatin AmericaLatviaLebanonLiberiaLithuaniaMalaysiaMexicoMicronesiaMiddle AfricaMoldovaMoroccoNepalNetherlandsNicaraguaNigeriaNorth AmericaNorth MacedoniaNorthern AfricaNorthern EuropeNorwayOceaniaPakistanPanamaPeruPhilippinesPolandPortugalRomaniaRussiaSaudi ArabiaScotlandSenegalSerbiaSierra LeoneSingaporeSomaliaSouth AfricaSouth AmericaSouth Central AsiaSouth Eastern AsiaSouthern EuropeSpainSri LankaSt. Vincent and the GrenadinesSudanSwedenSwitzerlandSyriaTaiwanThailandTrinidad and TobagoTurkeyUgandaUkraineUruguayUzbekistanVenezuelaVietnamWest IndiesWestern AfricaWestern AsiaWestern EuropeYemenZaireZimbabweAzores
Divorced or Separated
Income
Poverty
Unemployment
Labor Participation
Family Structure
Vehicle Availability
Education Level
Disability

Divorced or Separated Comparison

Bhutanese

Icelanders

Exceptional
Good
11.2%
DIVORCED OR SEPARATED
100.0/ 100
METRIC RATING
41st/ 347
METRIC RANK
12.0%
DIVORCED OR SEPARATED
66.0/ 100
METRIC RATING
158th/ 347
METRIC RANK

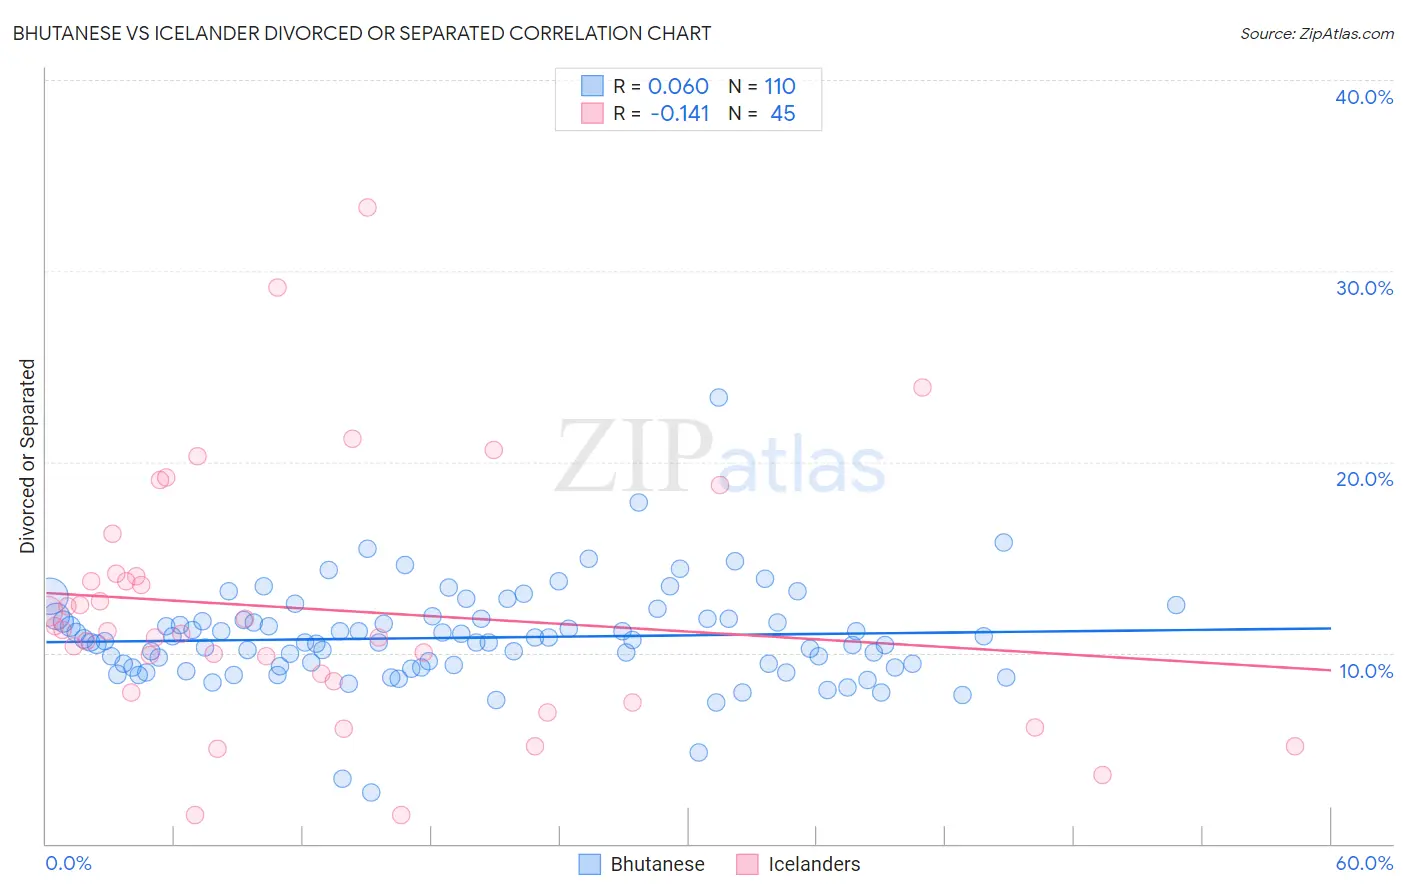
Bhutanese vs Icelander Divorced or Separated Correlation Chart

The statistical analysis conducted on geographies consisting of 455,285,816 people shows a slight positive correlation between the proportion of Bhutanese and percentage of population currently divorced or separated in the United States with a correlation coefficient (R) of 0.060 and weighted average of 11.2%. Similarly, the statistical analysis conducted on geographies consisting of 159,640,035 people shows a poor negative correlation between the proportion of Icelanders and percentage of population currently divorced or separated in the United States with a correlation coefficient (R) of -0.141 and weighted average of 12.0%, a difference of 7.2%.
Bhutanese vs Icelander Divorced or Separated

Divorced or Separated Correlation Summary

MeasurementBhutaneseIcelander
Minimum2.7%1.5%
Maximum23.4%33.3%
Range20.7%31.8%
Mean10.8%12.3%
Median10.6%11.1%
Interquartile 25% (IQ1)9.3%8.2%
Interquartile 75% (IQ3)11.8%14.1%
Interquartile Range (IQR)2.5%5.9%
Standard Deviation (Sample)2.6%6.6%
Standard Deviation (Population)2.6%6.5%

Similar Demographics by Divorced or Separated

Demographics Similar to Bhutanese by Divorced or Separated

In terms of divorced or separated, the demographic groups most similar to Bhutanese are Chinese (11.2%, a difference of 0.060%), Immigrants from Belarus (11.2%, a difference of 0.070%), Immigrants from Western Asia (11.2%, a difference of 0.090%), Turkish (11.2%, a difference of 0.13%), and Laotian (11.2%, a difference of 0.24%).
DemographicsRating | RankDivorced or Separated
Immigrants | Uzbekistan
100.0
/100
|
#34
Exceptional
11.1%
Cambodians
100.0
/100
|
#35
Exceptional
11.1%
Immigrants | Japan
100.0
/100
|
#36
Exceptional
11.1%
Immigrants | Lebanon
100.0
/100
|
#37
Exceptional
11.1%
Immigrants | Greece
100.0
/100
|
#38
Exceptional
11.1%
Immigrants | Egypt
100.0
/100
|
#39
Exceptional
11.1%
Soviet Union
100.0
/100
|
#40
Exceptional
11.1%
Bhutanese
100.0
/100
|
#41
Exceptional
11.2%
Chinese
100.0
/100
|
#42
Exceptional
11.2%
Immigrants | Belarus
100.0
/100
|
#43
Exceptional
11.2%
Immigrants | Western Asia
100.0
/100
|
#44
Exceptional
11.2%
Turks
100.0
/100
|
#45
Exceptional
11.2%
Laotians
100.0
/100
|
#46
Exceptional
11.2%
Immigrants | Poland
100.0
/100
|
#47
Exceptional
11.2%
Immigrants | Turkey
100.0
/100
|
#48
Exceptional
11.2%

Demographics Similar to Icelanders by Divorced or Separated

In terms of divorced or separated, the demographic groups most similar to Icelanders are Immigrants from Barbados (12.0%, a difference of 0.0%), Immigrants from Scotland (12.0%, a difference of 0.010%), Marshallese (12.0%, a difference of 0.060%), Samoan (12.0%, a difference of 0.070%), and Navajo (12.0%, a difference of 0.080%).
DemographicsRating | RankDivorced or Separated
Czechs
76.4
/100
|
#151
Good
11.9%
Immigrants | Hungary
73.7
/100
|
#152
Good
11.9%
Austrians
72.2
/100
|
#153
Good
12.0%
Chileans
71.3
/100
|
#154
Good
12.0%
Japanese
70.9
/100
|
#155
Good
12.0%
Hungarians
70.3
/100
|
#156
Good
12.0%
Immigrants | Brazil
68.8
/100
|
#157
Good
12.0%
Icelanders
66.0
/100
|
#158
Good
12.0%
Immigrants | Barbados
66.0
/100
|
#159
Good
12.0%
Immigrants | Scotland
65.8
/100
|
#160
Good
12.0%
Marshallese
64.6
/100
|
#161
Good
12.0%
Samoans
64.3
/100
|
#162
Good
12.0%
Navajo
63.9
/100
|
#163
Good
12.0%
Swiss
63.6
/100
|
#164
Good
12.0%
German Russians
61.8
/100
|
#165
Good
12.0%