Finnish vs Immigrants from Bulgaria Average Family Size
COMPARE
Finnish
Immigrants from Bulgaria
Average Family Size
Average Family Size Comparison
Finns
Immigrants from Bulgaria
3.09
AVERAGE FAMILY SIZE
0.0/ 100
METRIC RATING
340th/ 347
METRIC RANK
3.16
AVERAGE FAMILY SIZE
1.0/ 100
METRIC RATING
263rd/ 347
METRIC RANK
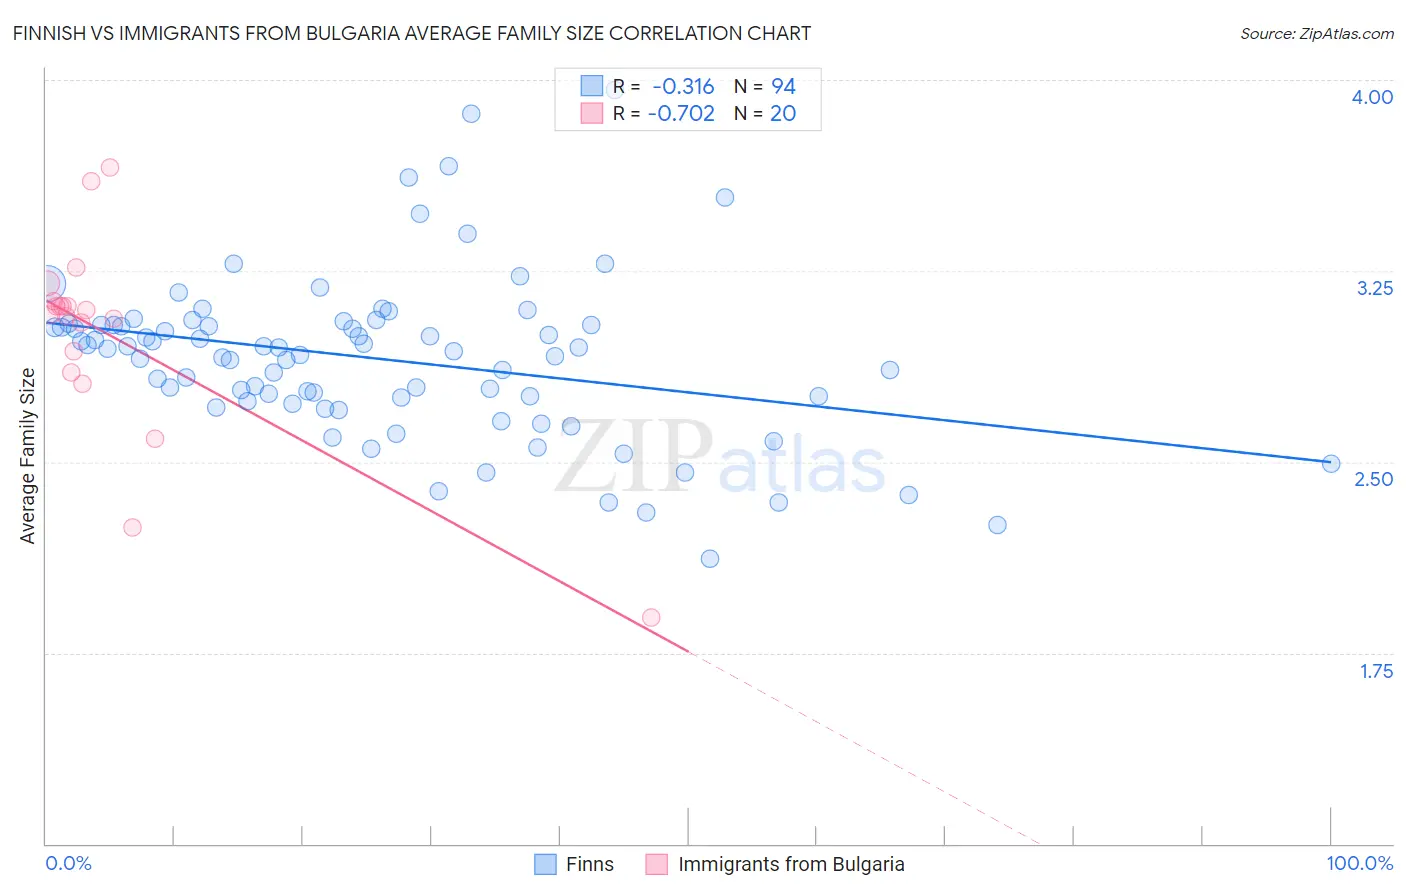
Finnish vs Immigrants from Bulgaria Average Family Size Correlation Chart
The statistical analysis conducted on geographies consisting of 404,508,275 people shows a mild negative correlation between the proportion of Finns and average family size in the United States with a correlation coefficient (R) of -0.316 and weighted average of 3.09. Similarly, the statistical analysis conducted on geographies consisting of 172,540,373 people shows a strong negative correlation between the proportion of Immigrants from Bulgaria and average family size in the United States with a correlation coefficient (R) of -0.702 and weighted average of 3.16, a difference of 2.2%.
Average Family Size Correlation Summary
| Measurement | Finnish | Immigrants from Bulgaria |
| Minimum | 2.12 | 1.89 |
| Maximum | 3.96 | 3.66 |
| Range | 1.84 | 1.77 |
| Mean | 2.90 | 3.00 |
| Median | 2.94 | 3.09 |
| Interquartile 25% (IQ1) | 2.74 | 2.89 |
| Interquartile 75% (IQ3) | 3.04 | 3.12 |
| Interquartile Range (IQR) | 0.30 | 0.23 |
| Standard Deviation (Sample) | 0.32 | 0.40 |
| Standard Deviation (Population) | 0.32 | 0.39 |
Similar Demographics by Average Family Size
Demographics Similar to Finns by Average Family Size
In terms of average family size, the demographic groups most similar to Finns are Polish (3.09, a difference of 0.050%), Croatian (3.10, a difference of 0.14%), French (3.10, a difference of 0.16%), Swedish (3.10, a difference of 0.18%), and German (3.09, a difference of 0.19%).
| Demographics | Rating | Rank | Average Family Size |
| Estonians | 0.0 /100 | #333 | Tragic 3.10 |
| Lithuanians | 0.0 /100 | #334 | Tragic 3.10 |
| Luxembourgers | 0.0 /100 | #335 | Tragic 3.10 |
| Irish | 0.0 /100 | #336 | Tragic 3.10 |
| Swedes | 0.0 /100 | #337 | Tragic 3.10 |
| French | 0.0 /100 | #338 | Tragic 3.10 |
| Croatians | 0.0 /100 | #339 | Tragic 3.10 |
| Finns | 0.0 /100 | #340 | Tragic 3.09 |
| Poles | 0.0 /100 | #341 | Tragic 3.09 |
| Germans | 0.0 /100 | #342 | Tragic 3.09 |
| Norwegians | 0.0 /100 | #343 | Tragic 3.08 |
| French Canadians | 0.0 /100 | #344 | Tragic 3.07 |
| Slovenes | 0.0 /100 | #345 | Tragic 3.07 |
| Slovaks | 0.0 /100 | #346 | Tragic 3.06 |
| Carpatho Rusyns | 0.0 /100 | #347 | Tragic 3.06 |
Demographics Similar to Immigrants from Bulgaria by Average Family Size
In terms of average family size, the demographic groups most similar to Immigrants from Bulgaria are American (3.16, a difference of 0.020%), Immigrants from South Africa (3.16, a difference of 0.070%), Immigrants from Greece (3.16, a difference of 0.080%), Immigrants from North Macedonia (3.16, a difference of 0.10%), and Immigrants from Russia (3.16, a difference of 0.10%).
| Demographics | Rating | Rank | Average Family Size |
| Immigrants | Kazakhstan | 1.5 /100 | #256 | Tragic 3.17 |
| Albanians | 1.5 /100 | #257 | Tragic 3.17 |
| Turks | 1.3 /100 | #258 | Tragic 3.16 |
| Potawatomi | 1.3 /100 | #259 | Tragic 3.16 |
| Immigrants | Albania | 1.3 /100 | #260 | Tragic 3.16 |
| Immigrants | North Macedonia | 1.3 /100 | #261 | Tragic 3.16 |
| Immigrants | Russia | 1.3 /100 | #262 | Tragic 3.16 |
| Immigrants | Bulgaria | 1.0 /100 | #263 | Tragic 3.16 |
| Americans | 1.0 /100 | #264 | Tragic 3.16 |
| Immigrants | South Africa | 0.9 /100 | #265 | Tragic 3.16 |
| Immigrants | Greece | 0.9 /100 | #266 | Tragic 3.16 |
| Iroquois | 0.8 /100 | #267 | Tragic 3.16 |
| Maltese | 0.8 /100 | #268 | Tragic 3.16 |
| Immigrants | Singapore | 0.7 /100 | #269 | Tragic 3.16 |
| Tlingit-Haida | 0.7 /100 | #270 | Tragic 3.16 |