White/Caucasian vs Immigrants from Bulgaria Average Family Size
COMPARE
White/Caucasian
Immigrants from Bulgaria
Average Family Size
Average Family Size Comparison
Whites/Caucasians
Immigrants from Bulgaria
3.14
AVERAGE FAMILY SIZE
0.3/ 100
METRIC RATING
285th/ 347
METRIC RANK
3.16
AVERAGE FAMILY SIZE
1.0/ 100
METRIC RATING
263rd/ 347
METRIC RANK
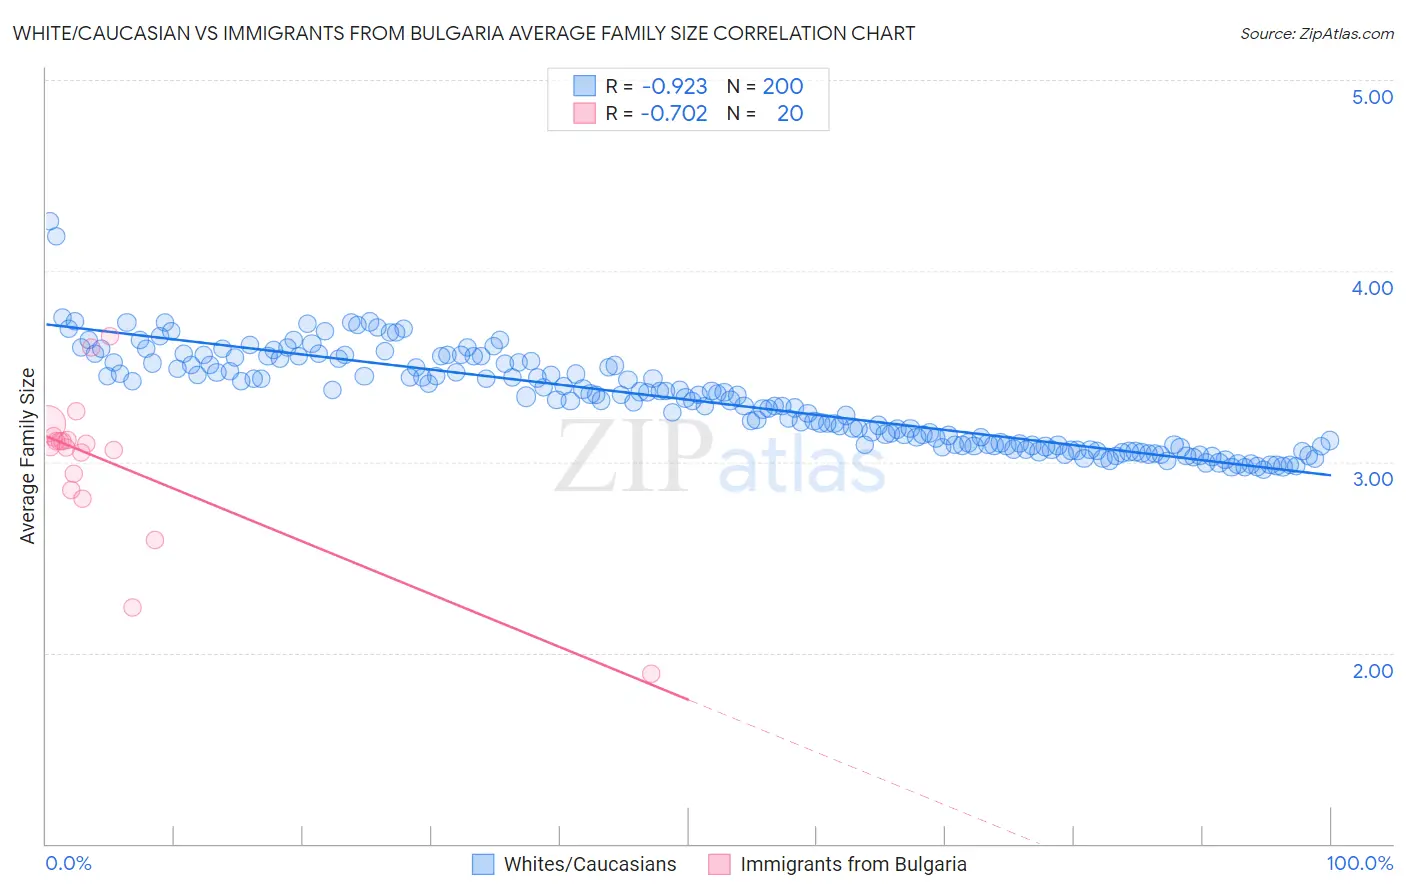
White/Caucasian vs Immigrants from Bulgaria Average Family Size Correlation Chart
The statistical analysis conducted on geographies consisting of 584,525,704 people shows a near-perfect negative correlation between the proportion of Whites/Caucasians and average family size in the United States with a correlation coefficient (R) of -0.923 and weighted average of 3.14. Similarly, the statistical analysis conducted on geographies consisting of 172,540,373 people shows a strong negative correlation between the proportion of Immigrants from Bulgaria and average family size in the United States with a correlation coefficient (R) of -0.702 and weighted average of 3.16, a difference of 0.54%.
Average Family Size Correlation Summary
| Measurement | White/Caucasian | Immigrants from Bulgaria |
| Minimum | 2.96 | 1.89 |
| Maximum | 4.26 | 3.66 |
| Range | 1.30 | 1.77 |
| Mean | 3.32 | 3.00 |
| Median | 3.33 | 3.09 |
| Interquartile 25% (IQ1) | 3.09 | 2.89 |
| Interquartile 75% (IQ3) | 3.52 | 3.12 |
| Interquartile Range (IQR) | 0.43 | 0.23 |
| Standard Deviation (Sample) | 0.25 | 0.40 |
| Standard Deviation (Population) | 0.25 | 0.39 |
Similar Demographics by Average Family Size
Demographics Similar to Whites/Caucasians by Average Family Size
In terms of average family size, the demographic groups most similar to Whites/Caucasians are Immigrants from France (3.15, a difference of 0.050%), Immigrants from Netherlands (3.14, a difference of 0.050%), Greek (3.14, a difference of 0.060%), Immigrants from Czechoslovakia (3.14, a difference of 0.060%), and Immigrants from Norway (3.14, a difference of 0.060%).
| Demographics | Rating | Rank | Average Family Size |
| Okinawans | 0.5 /100 | #278 | Tragic 3.15 |
| Immigrants | Europe | 0.5 /100 | #279 | Tragic 3.15 |
| Immigrants | England | 0.4 /100 | #280 | Tragic 3.15 |
| Immigrants | Denmark | 0.4 /100 | #281 | Tragic 3.15 |
| Yugoslavians | 0.4 /100 | #282 | Tragic 3.15 |
| German Russians | 0.4 /100 | #283 | Tragic 3.15 |
| Immigrants | France | 0.4 /100 | #284 | Tragic 3.15 |
| Whites/Caucasians | 0.3 /100 | #285 | Tragic 3.14 |
| Immigrants | Netherlands | 0.3 /100 | #286 | Tragic 3.14 |
| Greeks | 0.3 /100 | #287 | Tragic 3.14 |
| Immigrants | Czechoslovakia | 0.3 /100 | #288 | Tragic 3.14 |
| Immigrants | Norway | 0.3 /100 | #289 | Tragic 3.14 |
| Cypriots | 0.3 /100 | #290 | Tragic 3.14 |
| Alsatians | 0.2 /100 | #291 | Tragic 3.14 |
| Europeans | 0.2 /100 | #292 | Tragic 3.14 |
Demographics Similar to Immigrants from Bulgaria by Average Family Size
In terms of average family size, the demographic groups most similar to Immigrants from Bulgaria are American (3.16, a difference of 0.020%), Immigrants from South Africa (3.16, a difference of 0.070%), Immigrants from Greece (3.16, a difference of 0.080%), Immigrants from North Macedonia (3.16, a difference of 0.10%), and Immigrants from Russia (3.16, a difference of 0.10%).
| Demographics | Rating | Rank | Average Family Size |
| Immigrants | Kazakhstan | 1.5 /100 | #256 | Tragic 3.17 |
| Albanians | 1.5 /100 | #257 | Tragic 3.17 |
| Turks | 1.3 /100 | #258 | Tragic 3.16 |
| Potawatomi | 1.3 /100 | #259 | Tragic 3.16 |
| Immigrants | Albania | 1.3 /100 | #260 | Tragic 3.16 |
| Immigrants | North Macedonia | 1.3 /100 | #261 | Tragic 3.16 |
| Immigrants | Russia | 1.3 /100 | #262 | Tragic 3.16 |
| Immigrants | Bulgaria | 1.0 /100 | #263 | Tragic 3.16 |
| Americans | 1.0 /100 | #264 | Tragic 3.16 |
| Immigrants | South Africa | 0.9 /100 | #265 | Tragic 3.16 |
| Immigrants | Greece | 0.9 /100 | #266 | Tragic 3.16 |
| Iroquois | 0.8 /100 | #267 | Tragic 3.16 |
| Maltese | 0.8 /100 | #268 | Tragic 3.16 |
| Immigrants | Singapore | 0.7 /100 | #269 | Tragic 3.16 |
| Tlingit-Haida | 0.7 /100 | #270 | Tragic 3.16 |