Bhutanese vs Immigrants from Bulgaria 5th Grade
COMPARE
Bhutanese
Immigrants from Bulgaria
5th Grade
5th Grade Comparison
Bhutanese
Immigrants from Bulgaria
97.7%
5TH GRADE
97.6/ 100
METRIC RATING
105th/ 347
METRIC RANK
97.6%
5TH GRADE
93.1/ 100
METRIC RATING
125th/ 347
METRIC RANK
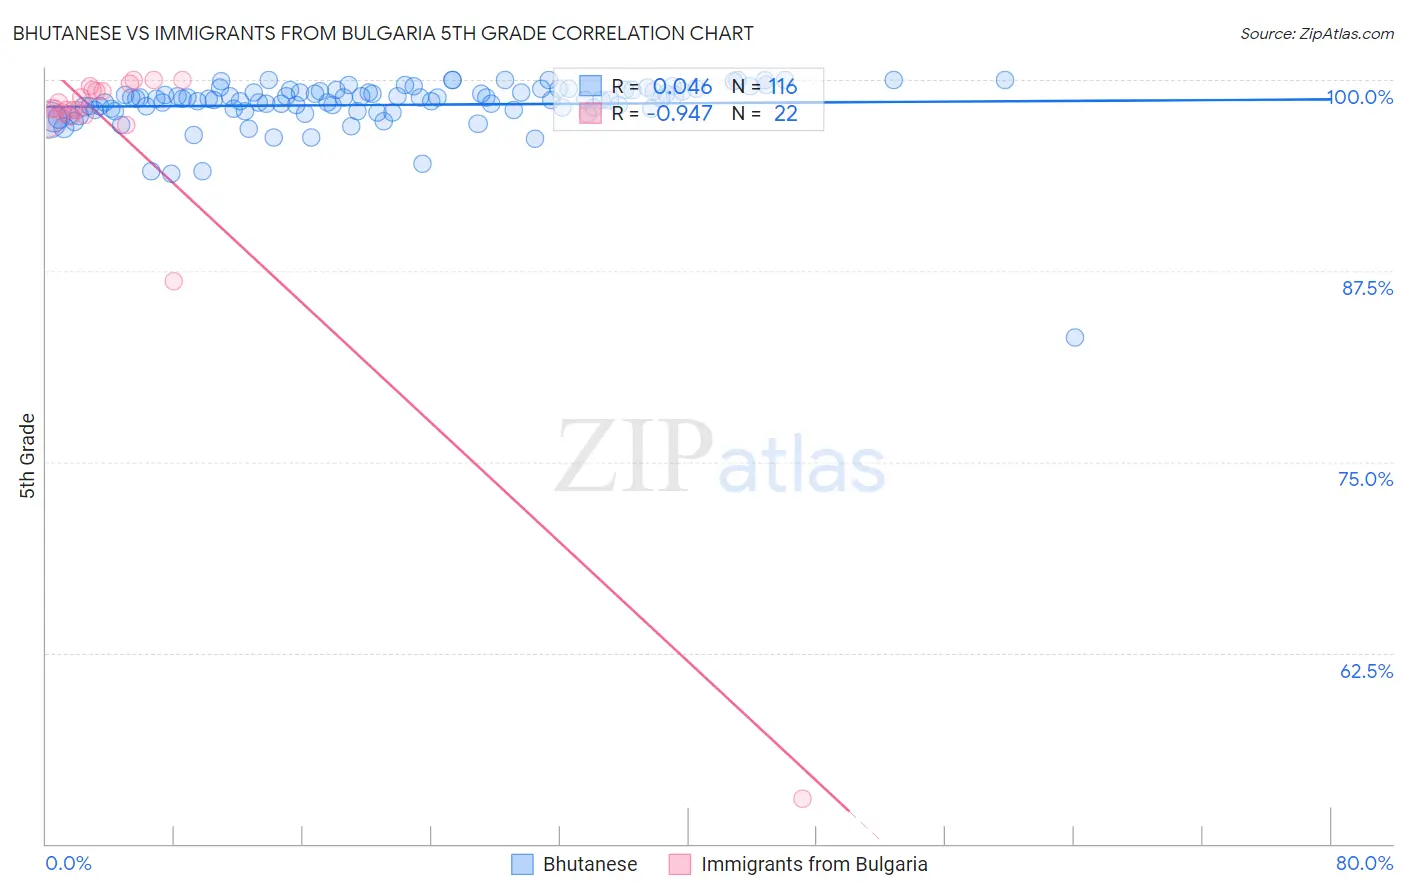
Bhutanese vs Immigrants from Bulgaria 5th Grade Correlation Chart
The statistical analysis conducted on geographies consisting of 455,591,134 people shows no correlation between the proportion of Bhutanese and percentage of population with at least 5th grade education in the United States with a correlation coefficient (R) of 0.046 and weighted average of 97.7%. Similarly, the statistical analysis conducted on geographies consisting of 172,552,181 people shows a near-perfect negative correlation between the proportion of Immigrants from Bulgaria and percentage of population with at least 5th grade education in the United States with a correlation coefficient (R) of -0.947 and weighted average of 97.6%, a difference of 0.11%.
5th Grade Correlation Summary
| Measurement | Bhutanese | Immigrants from Bulgaria |
| Minimum | 83.2% | 52.9% |
| Maximum | 100.0% | 100.0% |
| Range | 16.8% | 47.1% |
| Mean | 98.4% | 96.0% |
| Median | 98.7% | 98.1% |
| Interquartile 25% (IQ1) | 98.0% | 97.7% |
| Interquartile 75% (IQ3) | 99.3% | 99.4% |
| Interquartile Range (IQR) | 1.3% | 1.7% |
| Standard Deviation (Sample) | 1.9% | 10.0% |
| Standard Deviation (Population) | 1.9% | 9.8% |
Demographics Similar to Bhutanese and Immigrants from Bulgaria by 5th Grade
In terms of 5th grade, the demographic groups most similar to Bhutanese are Immigrants from Czechoslovakia (97.7%, a difference of 0.0%), Immigrants from Singapore (97.7%, a difference of 0.0%), Nonimmigrants (97.7%, a difference of 0.010%), Immigrants from Latvia (97.7%, a difference of 0.020%), and Thai (97.7%, a difference of 0.030%). Similarly, the demographic groups most similar to Immigrants from Bulgaria are Spanish (97.6%, a difference of 0.010%), Immigrants from Zimbabwe (97.6%, a difference of 0.030%), Immigrants from France (97.6%, a difference of 0.030%), Immigrants from Japan (97.6%, a difference of 0.030%), and Immigrants from Norway (97.6%, a difference of 0.030%).
| Demographics | Rating | Rank | 5th Grade |
| Bhutanese | 97.6 /100 | #105 | Exceptional 97.7% |
| Immigrants | Czechoslovakia | 97.5 /100 | #106 | Exceptional 97.7% |
| Immigrants | Singapore | 97.5 /100 | #107 | Exceptional 97.7% |
| Immigrants | Nonimmigrants | 97.3 /100 | #108 | Exceptional 97.7% |
| Immigrants | Latvia | 97.1 /100 | #109 | Exceptional 97.7% |
| Thais | 96.9 /100 | #110 | Exceptional 97.7% |
| Menominee | 96.3 /100 | #111 | Exceptional 97.7% |
| Immigrants | Switzerland | 96.0 /100 | #112 | Exceptional 97.7% |
| Iroquois | 95.9 /100 | #113 | Exceptional 97.7% |
| Lebanese | 95.7 /100 | #114 | Exceptional 97.6% |
| Okinawans | 95.7 /100 | #115 | Exceptional 97.6% |
| Immigrants | Croatia | 95.5 /100 | #116 | Exceptional 97.6% |
| Immigrants | Saudi Arabia | 95.4 /100 | #117 | Exceptional 97.6% |
| Basques | 95.2 /100 | #118 | Exceptional 97.6% |
| Syrians | 95.1 /100 | #119 | Exceptional 97.6% |
| Immigrants | Zimbabwe | 94.9 /100 | #120 | Exceptional 97.6% |
| Immigrants | France | 94.8 /100 | #121 | Exceptional 97.6% |
| Immigrants | Japan | 94.7 /100 | #122 | Exceptional 97.6% |
| Immigrants | Norway | 94.6 /100 | #123 | Exceptional 97.6% |
| Spanish | 93.7 /100 | #124 | Exceptional 97.6% |
| Immigrants | Bulgaria | 93.1 /100 | #125 | Exceptional 97.6% |