Afghan vs Immigrants from Bulgaria Average Family Size
COMPARE
Afghan
Immigrants from Bulgaria
Average Family Size
Average Family Size Comparison
Afghans
Immigrants from Bulgaria
3.31
AVERAGE FAMILY SIZE
99.7/ 100
METRIC RATING
85th/ 347
METRIC RANK
3.16
AVERAGE FAMILY SIZE
1.0/ 100
METRIC RATING
263rd/ 347
METRIC RANK
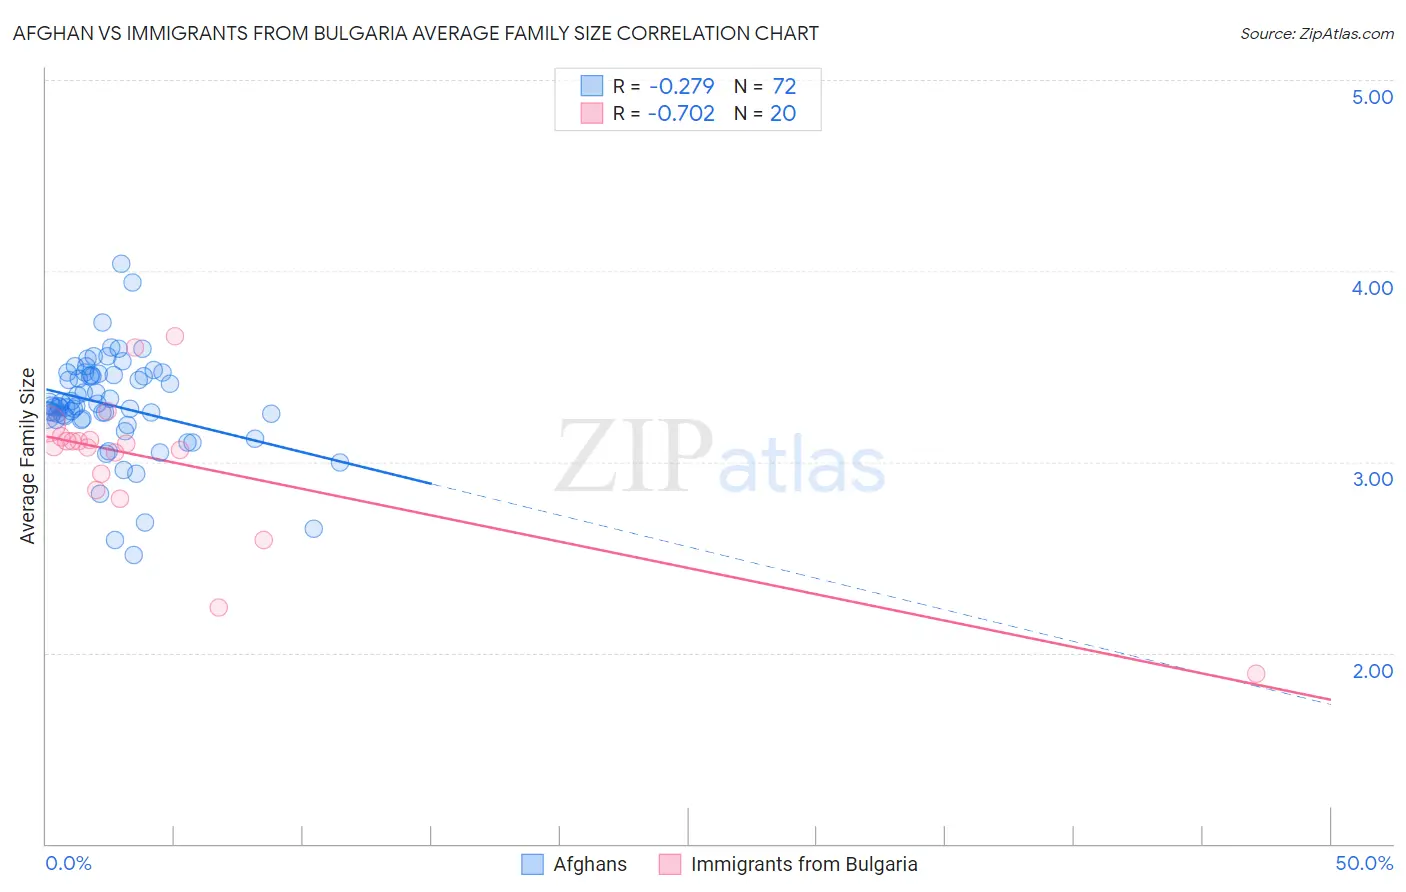
Afghan vs Immigrants from Bulgaria Average Family Size Correlation Chart
The statistical analysis conducted on geographies consisting of 148,832,546 people shows a weak negative correlation between the proportion of Afghans and average family size in the United States with a correlation coefficient (R) of -0.279 and weighted average of 3.31. Similarly, the statistical analysis conducted on geographies consisting of 172,540,373 people shows a strong negative correlation between the proportion of Immigrants from Bulgaria and average family size in the United States with a correlation coefficient (R) of -0.702 and weighted average of 3.16, a difference of 4.8%.
Average Family Size Correlation Summary
| Measurement | Afghan | Immigrants from Bulgaria |
| Minimum | 2.51 | 1.89 |
| Maximum | 4.04 | 3.66 |
| Range | 1.53 | 1.77 |
| Mean | 3.30 | 3.00 |
| Median | 3.29 | 3.09 |
| Interquartile 25% (IQ1) | 3.22 | 2.89 |
| Interquartile 75% (IQ3) | 3.46 | 3.12 |
| Interquartile Range (IQR) | 0.23 | 0.23 |
| Standard Deviation (Sample) | 0.26 | 0.40 |
| Standard Deviation (Population) | 0.26 | 0.39 |
Similar Demographics by Average Family Size
Demographics Similar to Afghans by Average Family Size
In terms of average family size, the demographic groups most similar to Afghans are Jamaican (3.31, a difference of 0.020%), Immigrants from Nigeria (3.32, a difference of 0.040%), Immigrants from Peru (3.31, a difference of 0.070%), Immigrants from Afghanistan (3.32, a difference of 0.080%), and Ecuadorian (3.32, a difference of 0.090%).
| Demographics | Rating | Rank | Average Family Size |
| Immigrants | Micronesia | 99.8 /100 | #78 | Exceptional 3.32 |
| British West Indians | 99.8 /100 | #79 | Exceptional 3.32 |
| Lumbee | 99.8 /100 | #80 | Exceptional 3.32 |
| Immigrants | Dominica | 99.8 /100 | #81 | Exceptional 3.32 |
| Ecuadorians | 99.8 /100 | #82 | Exceptional 3.32 |
| Immigrants | Afghanistan | 99.8 /100 | #83 | Exceptional 3.32 |
| Immigrants | Nigeria | 99.7 /100 | #84 | Exceptional 3.32 |
| Afghans | 99.7 /100 | #85 | Exceptional 3.31 |
| Jamaicans | 99.7 /100 | #86 | Exceptional 3.31 |
| Immigrants | Peru | 99.7 /100 | #87 | Exceptional 3.31 |
| Immigrants | Bolivia | 99.6 /100 | #88 | Exceptional 3.31 |
| Malaysians | 99.6 /100 | #89 | Exceptional 3.31 |
| Menominee | 99.4 /100 | #90 | Exceptional 3.30 |
| Immigrants | Pakistan | 99.2 /100 | #91 | Exceptional 3.30 |
| Immigrants | Cameroon | 99.2 /100 | #92 | Exceptional 3.30 |
Demographics Similar to Immigrants from Bulgaria by Average Family Size
In terms of average family size, the demographic groups most similar to Immigrants from Bulgaria are American (3.16, a difference of 0.020%), Immigrants from South Africa (3.16, a difference of 0.070%), Immigrants from Greece (3.16, a difference of 0.080%), Immigrants from North Macedonia (3.16, a difference of 0.10%), and Immigrants from Russia (3.16, a difference of 0.10%).
| Demographics | Rating | Rank | Average Family Size |
| Immigrants | Kazakhstan | 1.5 /100 | #256 | Tragic 3.17 |
| Albanians | 1.5 /100 | #257 | Tragic 3.17 |
| Turks | 1.3 /100 | #258 | Tragic 3.16 |
| Potawatomi | 1.3 /100 | #259 | Tragic 3.16 |
| Immigrants | Albania | 1.3 /100 | #260 | Tragic 3.16 |
| Immigrants | North Macedonia | 1.3 /100 | #261 | Tragic 3.16 |
| Immigrants | Russia | 1.3 /100 | #262 | Tragic 3.16 |
| Immigrants | Bulgaria | 1.0 /100 | #263 | Tragic 3.16 |
| Americans | 1.0 /100 | #264 | Tragic 3.16 |
| Immigrants | South Africa | 0.9 /100 | #265 | Tragic 3.16 |
| Immigrants | Greece | 0.9 /100 | #266 | Tragic 3.16 |
| Iroquois | 0.8 /100 | #267 | Tragic 3.16 |
| Maltese | 0.8 /100 | #268 | Tragic 3.16 |
| Immigrants | Singapore | 0.7 /100 | #269 | Tragic 3.16 |
| Tlingit-Haida | 0.7 /100 | #270 | Tragic 3.16 |