Basque vs Immigrants from Micronesia Family Households
COMPARE
Basque
Immigrants from Micronesia
Family Households
Family Households Comparison
Basques
Immigrants from Micronesia
64.7%
FAMILY HOUSEHOLDS
85.5/ 100
METRIC RATING
138th/ 347
METRIC RANK
64.2%
FAMILY HOUSEHOLDS
42.3/ 100
METRIC RATING
177th/ 347
METRIC RANK
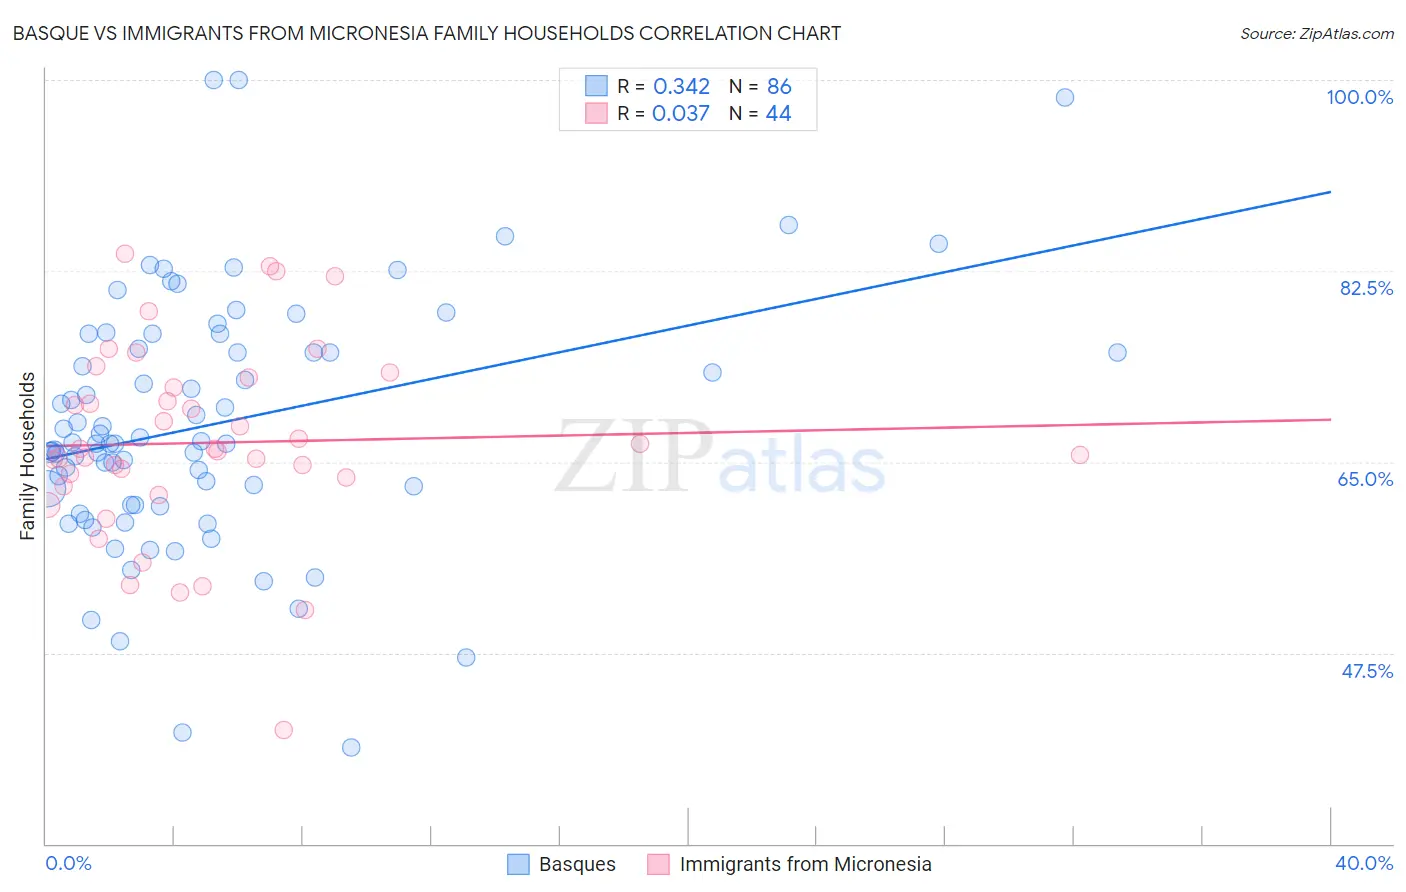
Basque vs Immigrants from Micronesia Family Households Correlation Chart
The statistical analysis conducted on geographies consisting of 165,752,297 people shows a mild positive correlation between the proportion of Basques and percentage of family households in the United States with a correlation coefficient (R) of 0.342 and weighted average of 64.7%. Similarly, the statistical analysis conducted on geographies consisting of 61,601,070 people shows no correlation between the proportion of Immigrants from Micronesia and percentage of family households in the United States with a correlation coefficient (R) of 0.037 and weighted average of 64.2%, a difference of 0.70%.
Family Households Correlation Summary
| Measurement | Basque | Immigrants from Micronesia |
| Minimum | 38.8% | 40.4% |
| Maximum | 100.0% | 84.1% |
| Range | 61.2% | 43.7% |
| Mean | 68.5% | 66.8% |
| Median | 66.7% | 66.1% |
| Interquartile 25% (IQ1) | 61.1% | 63.2% |
| Interquartile 75% (IQ3) | 75.3% | 72.3% |
| Interquartile Range (IQR) | 14.3% | 9.1% |
| Standard Deviation (Sample) | 11.5% | 8.9% |
| Standard Deviation (Population) | 11.4% | 8.8% |
Similar Demographics by Family Households
Demographics Similar to Basques by Family Households
In terms of family households, the demographic groups most similar to Basques are Immigrants from Jamaica (64.7%, a difference of 0.010%), Immigrants from Scotland (64.7%, a difference of 0.020%), Immigrants from North Macedonia (64.7%, a difference of 0.020%), Immigrants from Cameroon (64.7%, a difference of 0.020%), and Immigrants from China (64.7%, a difference of 0.030%).
| Demographics | Rating | Rank | Family Households |
| Immigrants | Nonimmigrants | 90.1 /100 | #131 | Exceptional 64.8% |
| Cajuns | 89.4 /100 | #132 | Excellent 64.8% |
| Belizeans | 89.3 /100 | #133 | Excellent 64.8% |
| Greeks | 88.1 /100 | #134 | Excellent 64.7% |
| Maltese | 87.4 /100 | #135 | Excellent 64.7% |
| Immigrants | China | 86.6 /100 | #136 | Excellent 64.7% |
| Immigrants | Scotland | 86.4 /100 | #137 | Excellent 64.7% |
| Basques | 85.5 /100 | #138 | Excellent 64.7% |
| Immigrants | Jamaica | 85.3 /100 | #139 | Excellent 64.7% |
| Immigrants | North Macedonia | 84.9 /100 | #140 | Excellent 64.7% |
| Immigrants | Cameroon | 84.8 /100 | #141 | Excellent 64.7% |
| Pakistanis | 84.0 /100 | #142 | Excellent 64.7% |
| Czechoslovakians | 82.1 /100 | #143 | Excellent 64.6% |
| South American Indians | 81.9 /100 | #144 | Excellent 64.6% |
| Welsh | 80.1 /100 | #145 | Excellent 64.6% |
Demographics Similar to Immigrants from Micronesia by Family Households
In terms of family households, the demographic groups most similar to Immigrants from Micronesia are Vietnamese (64.2%, a difference of 0.020%), Jamaican (64.2%, a difference of 0.020%), Bangladeshi (64.3%, a difference of 0.030%), Immigrants from Ukraine (64.2%, a difference of 0.060%), and Immigrants from Germany (64.3%, a difference of 0.10%).
| Demographics | Rating | Rank | Family Households |
| Armenians | 55.9 /100 | #170 | Average 64.4% |
| Ute | 54.6 /100 | #171 | Average 64.3% |
| Dutch West Indians | 53.9 /100 | #172 | Average 64.3% |
| Immigrants | Sierra Leone | 52.5 /100 | #173 | Average 64.3% |
| Immigrants | Germany | 50.0 /100 | #174 | Average 64.3% |
| Bangladeshis | 44.3 /100 | #175 | Average 64.3% |
| Vietnamese | 43.6 /100 | #176 | Average 64.2% |
| Immigrants | Micronesia | 42.3 /100 | #177 | Average 64.2% |
| Jamaicans | 40.6 /100 | #178 | Average 64.2% |
| Immigrants | Ukraine | 38.2 /100 | #179 | Fair 64.2% |
| Immigrants | Honduras | 35.0 /100 | #180 | Fair 64.2% |
| Immigrants | Trinidad and Tobago | 34.9 /100 | #181 | Fair 64.2% |
| Ukrainians | 34.6 /100 | #182 | Fair 64.2% |
| Creek | 34.1 /100 | #183 | Fair 64.2% |
| Puerto Ricans | 33.4 /100 | #184 | Fair 64.2% |