Albanian vs Immigrants from Micronesia Family Households
COMPARE
Albanian
Immigrants from Micronesia
Family Households
Family Households Comparison
Albanians
Immigrants from Micronesia
63.5%
FAMILY HOUSEHOLDS
2.2/ 100
METRIC RATING
235th/ 347
METRIC RANK
64.2%
FAMILY HOUSEHOLDS
42.3/ 100
METRIC RATING
177th/ 347
METRIC RANK
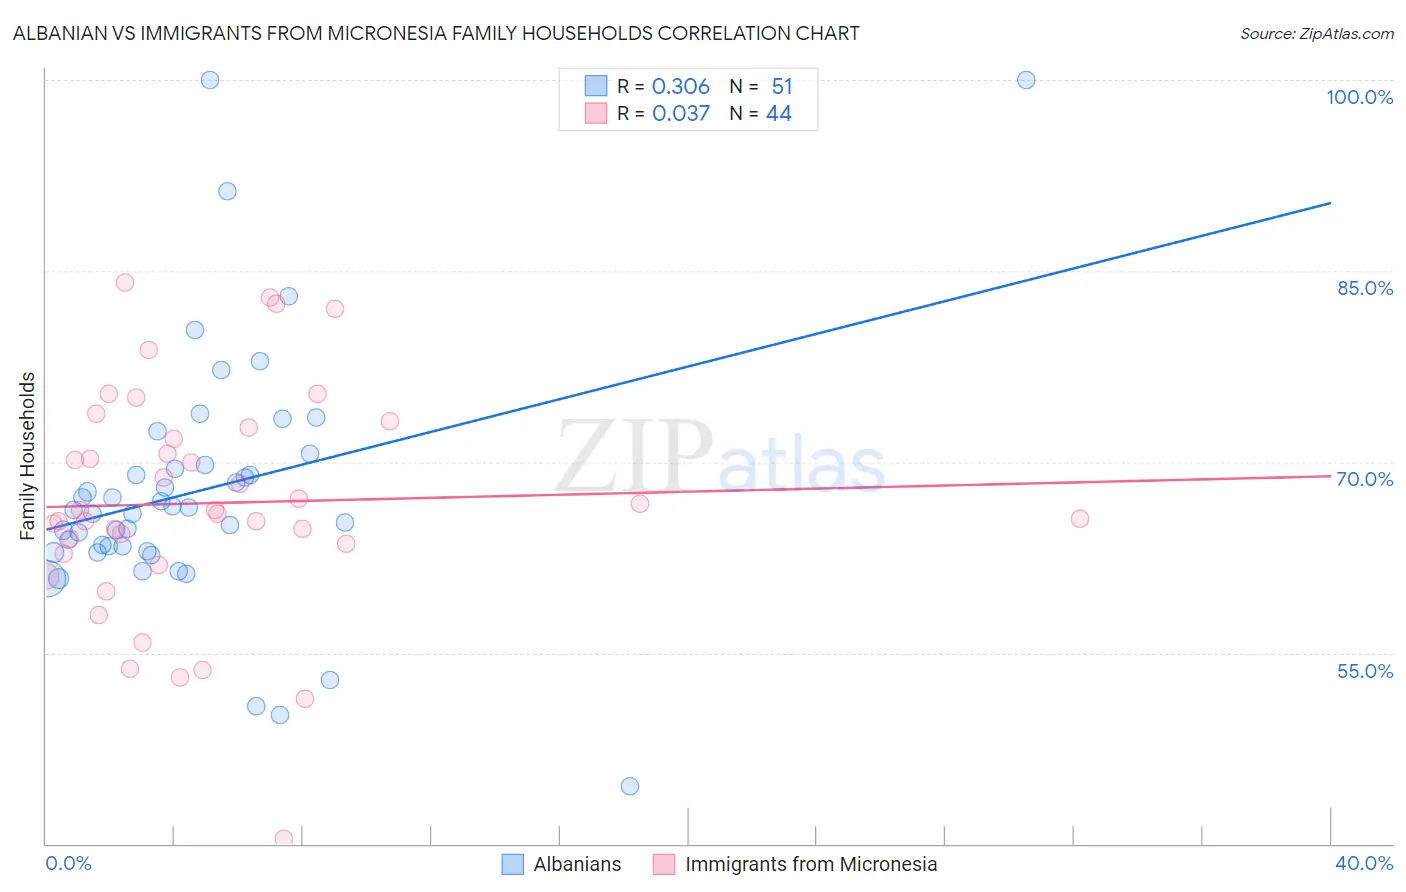
Albanian vs Immigrants from Micronesia Family Households Correlation Chart
The statistical analysis conducted on geographies consisting of 193,187,165 people shows a mild positive correlation between the proportion of Albanians and percentage of family households in the United States with a correlation coefficient (R) of 0.306 and weighted average of 63.5%. Similarly, the statistical analysis conducted on geographies consisting of 61,601,070 people shows no correlation between the proportion of Immigrants from Micronesia and percentage of family households in the United States with a correlation coefficient (R) of 0.037 and weighted average of 64.2%, a difference of 1.2%.
Family Households Correlation Summary
| Measurement | Albanian | Immigrants from Micronesia |
| Minimum | 44.5% | 40.4% |
| Maximum | 100.0% | 84.1% |
| Range | 55.5% | 43.7% |
| Mean | 67.7% | 66.8% |
| Median | 66.2% | 66.1% |
| Interquartile 25% (IQ1) | 62.9% | 63.2% |
| Interquartile 75% (IQ3) | 69.7% | 72.3% |
| Interquartile Range (IQR) | 6.8% | 9.1% |
| Standard Deviation (Sample) | 10.2% | 8.9% |
| Standard Deviation (Population) | 10.1% | 8.8% |
Similar Demographics by Family Households
Demographics Similar to Albanians by Family Households
In terms of family households, the demographic groups most similar to Albanians are Ghanaian (63.5%, a difference of 0.010%), Comanche (63.5%, a difference of 0.020%), Immigrants from Zimbabwe (63.5%, a difference of 0.020%), Finnish (63.5%, a difference of 0.030%), and Immigrants from Armenia (63.5%, a difference of 0.050%).
| Demographics | Rating | Rank | Family Households |
| Blackfeet | 3.6 /100 | #228 | Tragic 63.6% |
| Bulgarians | 3.4 /100 | #229 | Tragic 63.6% |
| Immigrants | Brazil | 3.0 /100 | #230 | Tragic 63.6% |
| Immigrants | Greece | 2.9 /100 | #231 | Tragic 63.5% |
| Immigrants | Northern Africa | 2.6 /100 | #232 | Tragic 63.5% |
| Immigrants | Armenia | 2.6 /100 | #233 | Tragic 63.5% |
| Finns | 2.3 /100 | #234 | Tragic 63.5% |
| Albanians | 2.2 /100 | #235 | Tragic 63.5% |
| Ghanaians | 2.1 /100 | #236 | Tragic 63.5% |
| Comanche | 2.1 /100 | #237 | Tragic 63.5% |
| Immigrants | Zimbabwe | 2.0 /100 | #238 | Tragic 63.5% |
| Aleuts | 1.9 /100 | #239 | Tragic 63.4% |
| South Africans | 1.9 /100 | #240 | Tragic 63.4% |
| Immigrants | St. Vincent and the Grenadines | 1.9 /100 | #241 | Tragic 63.4% |
| Immigrants | Israel | 1.8 /100 | #242 | Tragic 63.4% |
Demographics Similar to Immigrants from Micronesia by Family Households
In terms of family households, the demographic groups most similar to Immigrants from Micronesia are Vietnamese (64.2%, a difference of 0.020%), Jamaican (64.2%, a difference of 0.020%), Bangladeshi (64.3%, a difference of 0.030%), Immigrants from Ukraine (64.2%, a difference of 0.060%), and Immigrants from Germany (64.3%, a difference of 0.10%).
| Demographics | Rating | Rank | Family Households |
| Armenians | 55.9 /100 | #170 | Average 64.4% |
| Ute | 54.6 /100 | #171 | Average 64.3% |
| Dutch West Indians | 53.9 /100 | #172 | Average 64.3% |
| Immigrants | Sierra Leone | 52.5 /100 | #173 | Average 64.3% |
| Immigrants | Germany | 50.0 /100 | #174 | Average 64.3% |
| Bangladeshis | 44.3 /100 | #175 | Average 64.3% |
| Vietnamese | 43.6 /100 | #176 | Average 64.2% |
| Immigrants | Micronesia | 42.3 /100 | #177 | Average 64.2% |
| Jamaicans | 40.6 /100 | #178 | Average 64.2% |
| Immigrants | Ukraine | 38.2 /100 | #179 | Fair 64.2% |
| Immigrants | Honduras | 35.0 /100 | #180 | Fair 64.2% |
| Immigrants | Trinidad and Tobago | 34.9 /100 | #181 | Fair 64.2% |
| Ukrainians | 34.6 /100 | #182 | Fair 64.2% |
| Creek | 34.1 /100 | #183 | Fair 64.2% |
| Puerto Ricans | 33.4 /100 | #184 | Fair 64.2% |