Egyptian vs Immigrants from Micronesia Family Households
COMPARE
Egyptian
Immigrants from Micronesia
Family Households
Family Households Comparison
Egyptians
Immigrants from Micronesia
65.4%
FAMILY HOUSEHOLDS
99.4/ 100
METRIC RATING
86th/ 347
METRIC RANK
64.2%
FAMILY HOUSEHOLDS
42.3/ 100
METRIC RATING
177th/ 347
METRIC RANK
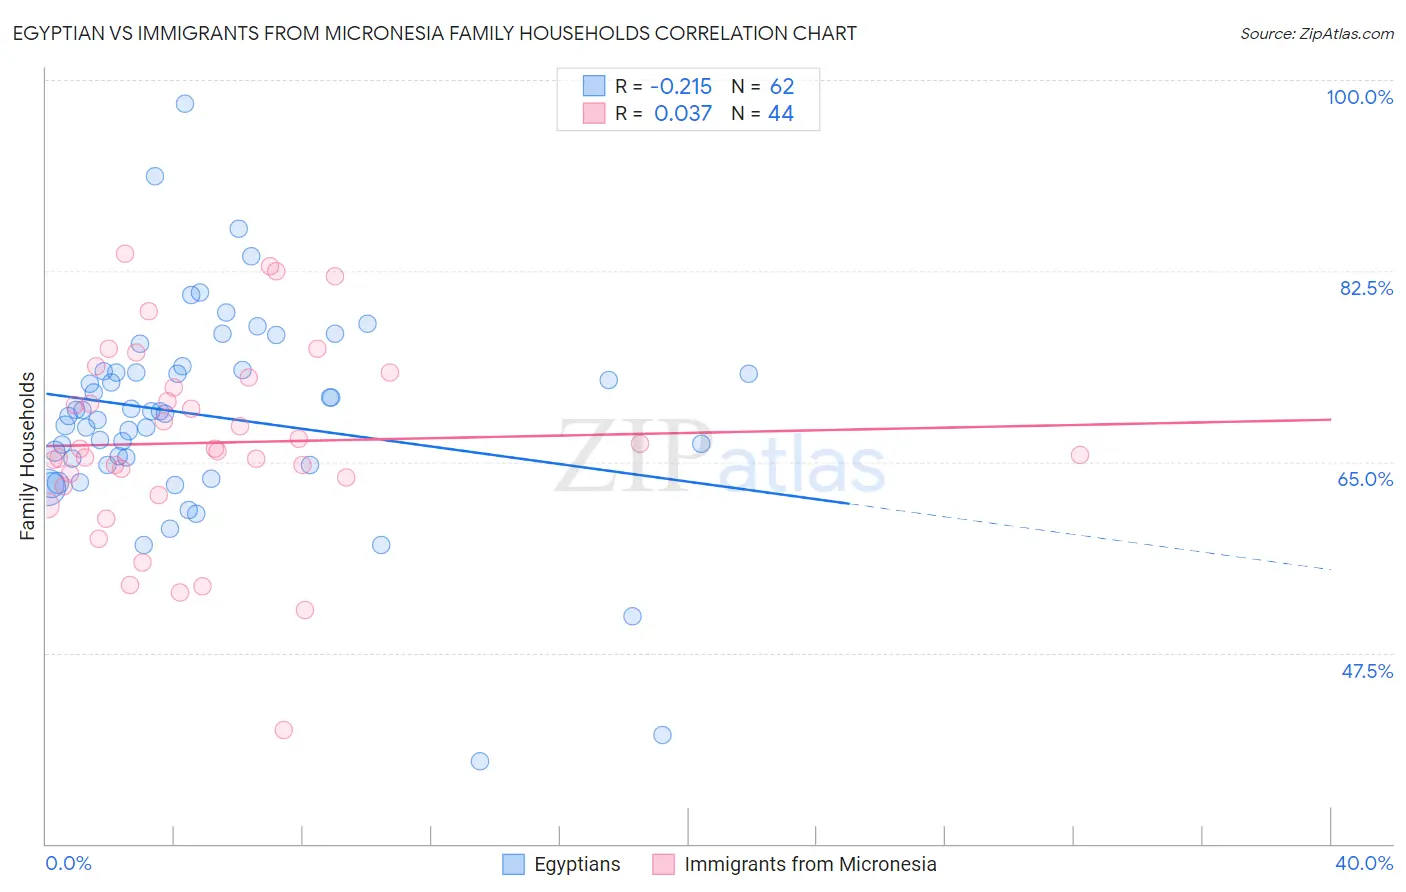
Egyptian vs Immigrants from Micronesia Family Households Correlation Chart
The statistical analysis conducted on geographies consisting of 276,780,466 people shows a weak negative correlation between the proportion of Egyptians and percentage of family households in the United States with a correlation coefficient (R) of -0.215 and weighted average of 65.4%. Similarly, the statistical analysis conducted on geographies consisting of 61,601,070 people shows no correlation between the proportion of Immigrants from Micronesia and percentage of family households in the United States with a correlation coefficient (R) of 0.037 and weighted average of 64.2%, a difference of 1.8%.
Family Households Correlation Summary
| Measurement | Egyptian | Immigrants from Micronesia |
| Minimum | 37.6% | 40.4% |
| Maximum | 97.8% | 84.1% |
| Range | 60.2% | 43.7% |
| Mean | 69.2% | 66.8% |
| Median | 69.5% | 66.1% |
| Interquartile 25% (IQ1) | 64.8% | 63.2% |
| Interquartile 75% (IQ3) | 73.3% | 72.3% |
| Interquartile Range (IQR) | 8.6% | 9.1% |
| Standard Deviation (Sample) | 9.7% | 8.9% |
| Standard Deviation (Population) | 9.6% | 8.8% |
Similar Demographics by Family Households
Demographics Similar to Egyptians by Family Households
In terms of family households, the demographic groups most similar to Egyptians are Immigrants from Cambodia (65.4%, a difference of 0.050%), Immigrants from Egypt (65.3%, a difference of 0.090%), Immigrants from Haiti (65.3%, a difference of 0.12%), Immigrants from Caribbean (65.3%, a difference of 0.13%), and Immigrants from Laos (65.3%, a difference of 0.14%).
| Demographics | Rating | Rank | Family Households |
| Immigrants | Costa Rica | 99.8 /100 | #79 | Exceptional 65.6% |
| Puget Sound Salish | 99.8 /100 | #80 | Exceptional 65.6% |
| Jordanians | 99.7 /100 | #81 | Exceptional 65.5% |
| Immigrants | Lebanon | 99.7 /100 | #82 | Exceptional 65.5% |
| Immigrants | Guyana | 99.6 /100 | #83 | Exceptional 65.5% |
| Americans | 99.6 /100 | #84 | Exceptional 65.5% |
| Immigrants | Cambodia | 99.5 /100 | #85 | Exceptional 65.4% |
| Egyptians | 99.4 /100 | #86 | Exceptional 65.4% |
| Immigrants | Egypt | 99.2 /100 | #87 | Exceptional 65.3% |
| Immigrants | Haiti | 99.1 /100 | #88 | Exceptional 65.3% |
| Immigrants | Caribbean | 99.1 /100 | #89 | Exceptional 65.3% |
| Immigrants | Laos | 99.1 /100 | #90 | Exceptional 65.3% |
| Crow | 98.9 /100 | #91 | Exceptional 65.3% |
| Hopi | 98.8 /100 | #92 | Exceptional 65.3% |
| Guyanese | 98.8 /100 | #93 | Exceptional 65.3% |
Demographics Similar to Immigrants from Micronesia by Family Households
In terms of family households, the demographic groups most similar to Immigrants from Micronesia are Vietnamese (64.2%, a difference of 0.020%), Jamaican (64.2%, a difference of 0.020%), Bangladeshi (64.3%, a difference of 0.030%), Immigrants from Ukraine (64.2%, a difference of 0.060%), and Immigrants from Germany (64.3%, a difference of 0.10%).
| Demographics | Rating | Rank | Family Households |
| Armenians | 55.9 /100 | #170 | Average 64.4% |
| Ute | 54.6 /100 | #171 | Average 64.3% |
| Dutch West Indians | 53.9 /100 | #172 | Average 64.3% |
| Immigrants | Sierra Leone | 52.5 /100 | #173 | Average 64.3% |
| Immigrants | Germany | 50.0 /100 | #174 | Average 64.3% |
| Bangladeshis | 44.3 /100 | #175 | Average 64.3% |
| Vietnamese | 43.6 /100 | #176 | Average 64.2% |
| Immigrants | Micronesia | 42.3 /100 | #177 | Average 64.2% |
| Jamaicans | 40.6 /100 | #178 | Average 64.2% |
| Immigrants | Ukraine | 38.2 /100 | #179 | Fair 64.2% |
| Immigrants | Honduras | 35.0 /100 | #180 | Fair 64.2% |
| Immigrants | Trinidad and Tobago | 34.9 /100 | #181 | Fair 64.2% |
| Ukrainians | 34.6 /100 | #182 | Fair 64.2% |
| Creek | 34.1 /100 | #183 | Fair 64.2% |
| Puerto Ricans | 33.4 /100 | #184 | Fair 64.2% |