Japanese vs Immigrants from Micronesia Family Households
COMPARE
Japanese
Immigrants from Micronesia
Family Households
Family Households Comparison
Japanese
Immigrants from Micronesia
65.9%
FAMILY HOUSEHOLDS
99.9/ 100
METRIC RATING
68th/ 347
METRIC RANK
64.2%
FAMILY HOUSEHOLDS
42.3/ 100
METRIC RATING
177th/ 347
METRIC RANK
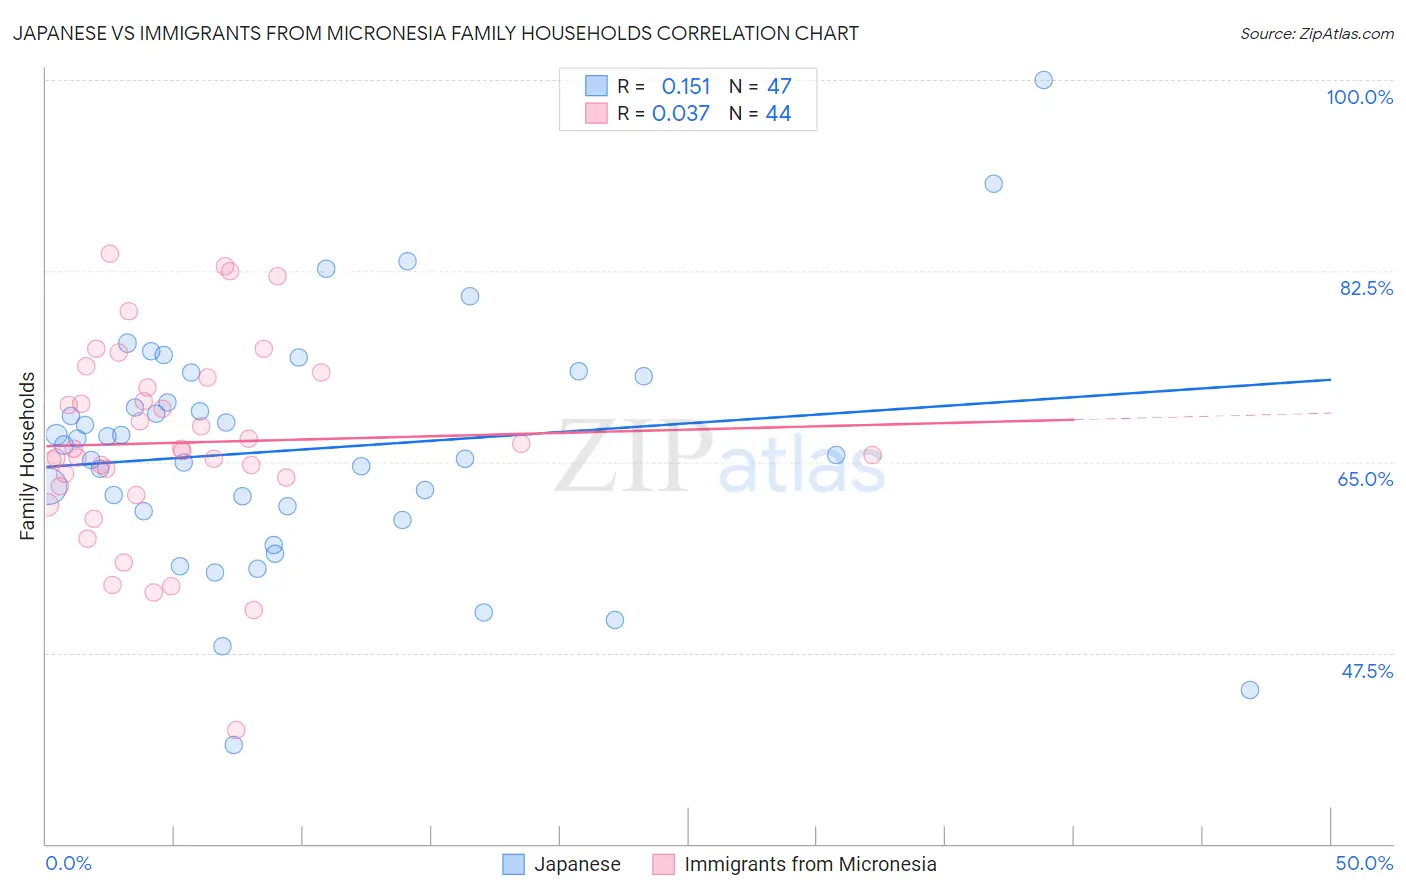
Japanese vs Immigrants from Micronesia Family Households Correlation Chart
The statistical analysis conducted on geographies consisting of 249,074,128 people shows a poor positive correlation between the proportion of Japanese and percentage of family households in the United States with a correlation coefficient (R) of 0.151 and weighted average of 65.9%. Similarly, the statistical analysis conducted on geographies consisting of 61,601,070 people shows no correlation between the proportion of Immigrants from Micronesia and percentage of family households in the United States with a correlation coefficient (R) of 0.037 and weighted average of 64.2%, a difference of 2.6%.
Family Households Correlation Summary
| Measurement | Japanese | Immigrants from Micronesia |
| Minimum | 39.1% | 40.4% |
| Maximum | 100.0% | 84.1% |
| Range | 60.9% | 43.7% |
| Mean | 66.2% | 66.8% |
| Median | 66.6% | 66.1% |
| Interquartile 25% (IQ1) | 60.5% | 63.2% |
| Interquartile 75% (IQ3) | 72.9% | 72.3% |
| Interquartile Range (IQR) | 12.4% | 9.1% |
| Standard Deviation (Sample) | 11.2% | 8.9% |
| Standard Deviation (Population) | 11.1% | 8.8% |
Similar Demographics by Family Households
Demographics Similar to Japanese by Family Households
In terms of family households, the demographic groups most similar to Japanese are Fijian (65.9%, a difference of 0.020%), Filipino (65.9%, a difference of 0.020%), Malaysian (65.9%, a difference of 0.030%), Immigrants from Afghanistan (65.9%, a difference of 0.040%), and Costa Rican (65.9%, a difference of 0.060%).
| Demographics | Rating | Rank | Family Households |
| Danes | 100.0 /100 | #61 | Exceptional 66.0% |
| Central Americans | 100.0 /100 | #62 | Exceptional 66.0% |
| Immigrants | Indonesia | 100.0 /100 | #63 | Exceptional 66.0% |
| Pima | 99.9 /100 | #64 | Exceptional 65.9% |
| Costa Ricans | 99.9 /100 | #65 | Exceptional 65.9% |
| Fijians | 99.9 /100 | #66 | Exceptional 65.9% |
| Filipinos | 99.9 /100 | #67 | Exceptional 65.9% |
| Japanese | 99.9 /100 | #68 | Exceptional 65.9% |
| Malaysians | 99.9 /100 | #69 | Exceptional 65.9% |
| Immigrants | Afghanistan | 99.9 /100 | #70 | Exceptional 65.9% |
| Bhutanese | 99.9 /100 | #71 | Exceptional 65.9% |
| Portuguese | 99.9 /100 | #72 | Exceptional 65.8% |
| Laotians | 99.9 /100 | #73 | Exceptional 65.8% |
| Burmese | 99.9 /100 | #74 | Exceptional 65.7% |
| Houma | 99.9 /100 | #75 | Exceptional 65.7% |
Demographics Similar to Immigrants from Micronesia by Family Households
In terms of family households, the demographic groups most similar to Immigrants from Micronesia are Vietnamese (64.2%, a difference of 0.020%), Jamaican (64.2%, a difference of 0.020%), Bangladeshi (64.3%, a difference of 0.030%), Immigrants from Ukraine (64.2%, a difference of 0.060%), and Immigrants from Germany (64.3%, a difference of 0.10%).
| Demographics | Rating | Rank | Family Households |
| Armenians | 55.9 /100 | #170 | Average 64.4% |
| Ute | 54.6 /100 | #171 | Average 64.3% |
| Dutch West Indians | 53.9 /100 | #172 | Average 64.3% |
| Immigrants | Sierra Leone | 52.5 /100 | #173 | Average 64.3% |
| Immigrants | Germany | 50.0 /100 | #174 | Average 64.3% |
| Bangladeshis | 44.3 /100 | #175 | Average 64.3% |
| Vietnamese | 43.6 /100 | #176 | Average 64.2% |
| Immigrants | Micronesia | 42.3 /100 | #177 | Average 64.2% |
| Jamaicans | 40.6 /100 | #178 | Average 64.2% |
| Immigrants | Ukraine | 38.2 /100 | #179 | Fair 64.2% |
| Immigrants | Honduras | 35.0 /100 | #180 | Fair 64.2% |
| Immigrants | Trinidad and Tobago | 34.9 /100 | #181 | Fair 64.2% |
| Ukrainians | 34.6 /100 | #182 | Fair 64.2% |
| Creek | 34.1 /100 | #183 | Fair 64.2% |
| Puerto Ricans | 33.4 /100 | #184 | Fair 64.2% |