Basque vs Immigrants from Central America Family Households
COMPARE
Basque
Immigrants from Central America
Family Households
Family Households Comparison
Basques
Immigrants from Central America
64.7%
FAMILY HOUSEHOLDS
85.5/ 100
METRIC RATING
138th/ 347
METRIC RANK
68.3%
FAMILY HOUSEHOLDS
100.0/ 100
METRIC RATING
11th/ 347
METRIC RANK
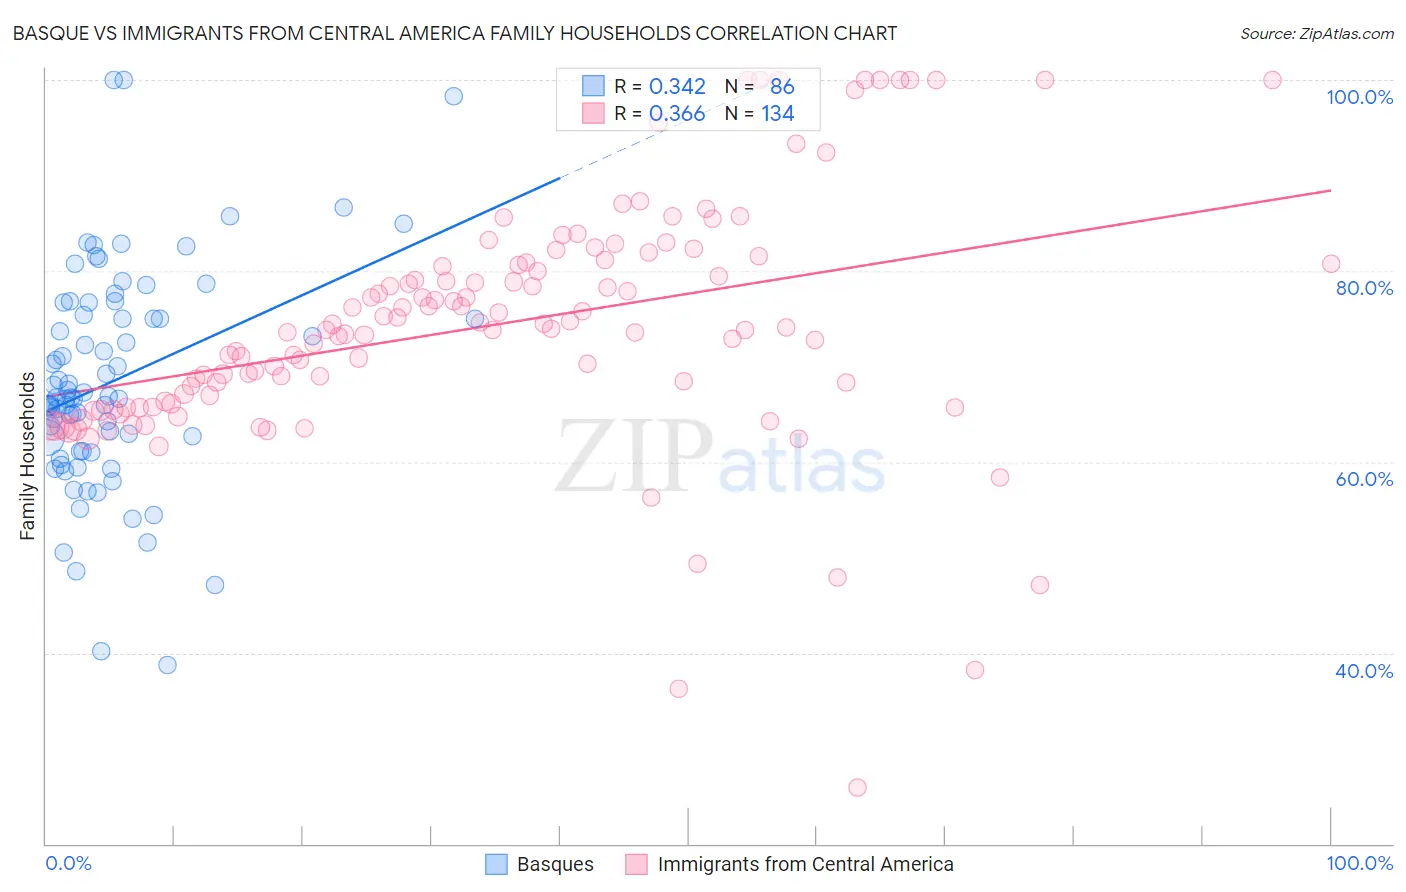
Basque vs Immigrants from Central America Family Households Correlation Chart
The statistical analysis conducted on geographies consisting of 165,752,297 people shows a mild positive correlation between the proportion of Basques and percentage of family households in the United States with a correlation coefficient (R) of 0.342 and weighted average of 64.7%. Similarly, the statistical analysis conducted on geographies consisting of 536,086,114 people shows a mild positive correlation between the proportion of Immigrants from Central America and percentage of family households in the United States with a correlation coefficient (R) of 0.366 and weighted average of 68.3%, a difference of 5.6%.
Family Households Correlation Summary
| Measurement | Basque | Immigrants from Central America |
| Minimum | 38.8% | 25.8% |
| Maximum | 100.0% | 100.0% |
| Range | 61.2% | 74.2% |
| Mean | 68.5% | 74.3% |
| Median | 66.7% | 73.9% |
| Interquartile 25% (IQ1) | 61.1% | 66.1% |
| Interquartile 75% (IQ3) | 75.3% | 80.8% |
| Interquartile Range (IQR) | 14.3% | 14.7% |
| Standard Deviation (Sample) | 11.5% | 12.7% |
| Standard Deviation (Population) | 11.4% | 12.7% |
Similar Demographics by Family Households
Demographics Similar to Basques by Family Households
In terms of family households, the demographic groups most similar to Basques are Immigrants from Jamaica (64.7%, a difference of 0.010%), Immigrants from Scotland (64.7%, a difference of 0.020%), Immigrants from North Macedonia (64.7%, a difference of 0.020%), Immigrants from Cameroon (64.7%, a difference of 0.020%), and Immigrants from China (64.7%, a difference of 0.030%).
| Demographics | Rating | Rank | Family Households |
| Immigrants | Nonimmigrants | 90.1 /100 | #131 | Exceptional 64.8% |
| Cajuns | 89.4 /100 | #132 | Excellent 64.8% |
| Belizeans | 89.3 /100 | #133 | Excellent 64.8% |
| Greeks | 88.1 /100 | #134 | Excellent 64.7% |
| Maltese | 87.4 /100 | #135 | Excellent 64.7% |
| Immigrants | China | 86.6 /100 | #136 | Excellent 64.7% |
| Immigrants | Scotland | 86.4 /100 | #137 | Excellent 64.7% |
| Basques | 85.5 /100 | #138 | Excellent 64.7% |
| Immigrants | Jamaica | 85.3 /100 | #139 | Excellent 64.7% |
| Immigrants | North Macedonia | 84.9 /100 | #140 | Excellent 64.7% |
| Immigrants | Cameroon | 84.8 /100 | #141 | Excellent 64.7% |
| Pakistanis | 84.0 /100 | #142 | Excellent 64.7% |
| Czechoslovakians | 82.1 /100 | #143 | Excellent 64.6% |
| South American Indians | 81.9 /100 | #144 | Excellent 64.6% |
| Welsh | 80.1 /100 | #145 | Excellent 64.6% |
Demographics Similar to Immigrants from Central America by Family Households
In terms of family households, the demographic groups most similar to Immigrants from Central America are Korean (68.3%, a difference of 0.030%), Immigrants from Philippines (68.3%, a difference of 0.070%), Pueblo (68.2%, a difference of 0.11%), Immigrants from Cuba (68.2%, a difference of 0.12%), and Native Hawaiian (68.4%, a difference of 0.14%).
| Demographics | Rating | Rank | Family Households |
| Yakama | 100.0 /100 | #4 | Exceptional 69.3% |
| Yuman | 100.0 /100 | #5 | Exceptional 69.3% |
| Immigrants | Mexico | 100.0 /100 | #6 | Exceptional 69.1% |
| Mexicans | 100.0 /100 | #7 | Exceptional 69.0% |
| Immigrants | Fiji | 100.0 /100 | #8 | Exceptional 68.8% |
| Native Hawaiians | 100.0 /100 | #9 | Exceptional 68.4% |
| Immigrants | Philippines | 100.0 /100 | #10 | Exceptional 68.3% |
| Immigrants | Central America | 100.0 /100 | #11 | Exceptional 68.3% |
| Koreans | 100.0 /100 | #12 | Exceptional 68.3% |
| Pueblo | 100.0 /100 | #13 | Exceptional 68.2% |
| Immigrants | Cuba | 100.0 /100 | #14 | Exceptional 68.2% |
| Assyrians/Chaldeans/Syriacs | 100.0 /100 | #15 | Exceptional 68.2% |
| Immigrants | Vietnam | 100.0 /100 | #16 | Exceptional 68.2% |
| Chinese | 100.0 /100 | #17 | Exceptional 68.1% |
| Immigrants | Taiwan | 100.0 /100 | #18 | Exceptional 68.0% |