Australian vs Immigrants from Micronesia Family Households
COMPARE
Australian
Immigrants from Micronesia
Family Households
Family Households Comparison
Australians
Immigrants from Micronesia
62.8%
FAMILY HOUSEHOLDS
0.1/ 100
METRIC RATING
284th/ 347
METRIC RANK
64.2%
FAMILY HOUSEHOLDS
42.3/ 100
METRIC RATING
177th/ 347
METRIC RANK
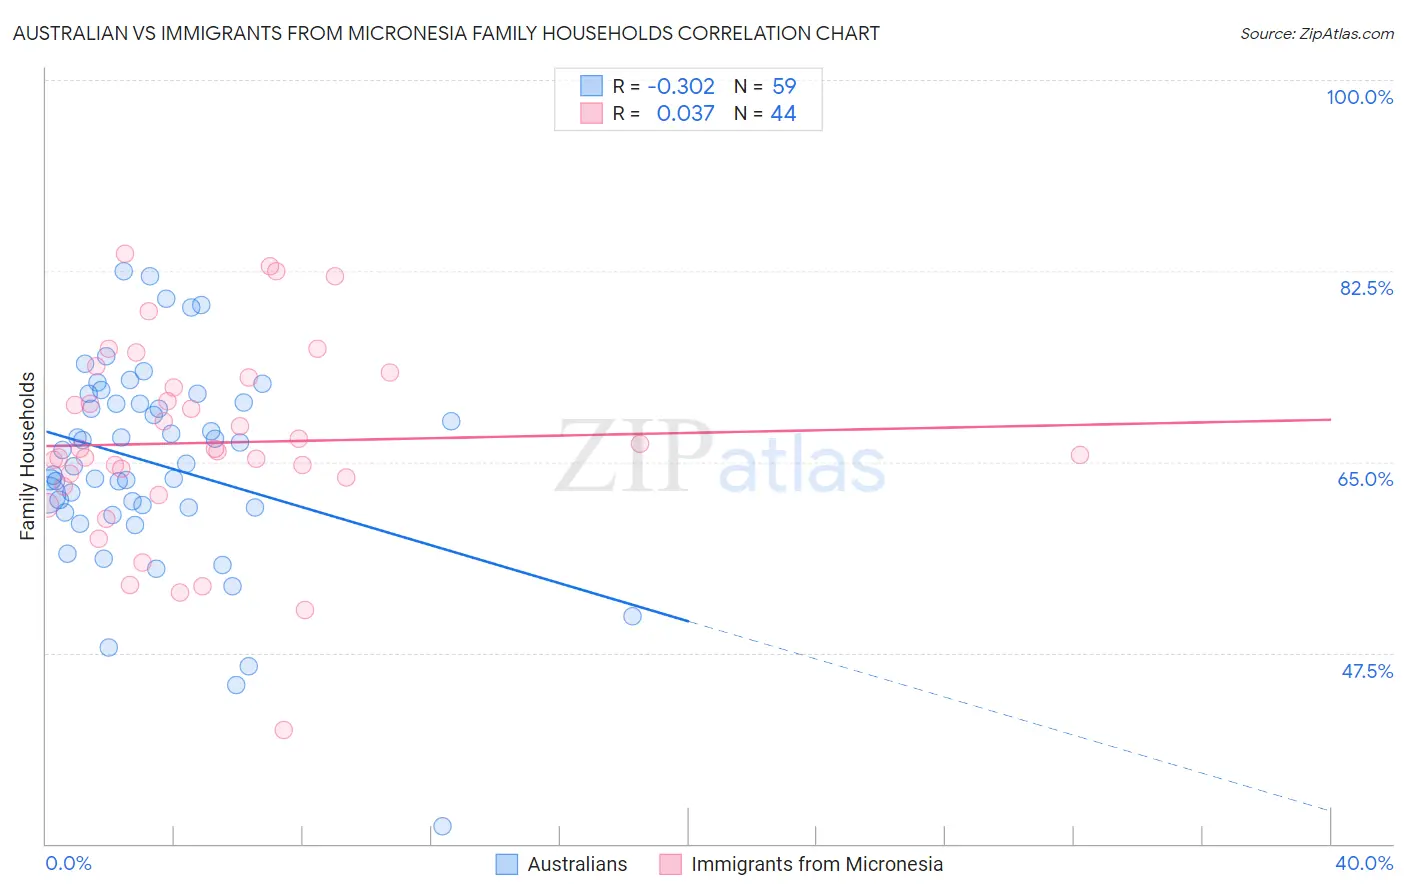
Australian vs Immigrants from Micronesia Family Households Correlation Chart
The statistical analysis conducted on geographies consisting of 224,034,220 people shows a mild negative correlation between the proportion of Australians and percentage of family households in the United States with a correlation coefficient (R) of -0.302 and weighted average of 62.8%. Similarly, the statistical analysis conducted on geographies consisting of 61,601,070 people shows no correlation between the proportion of Immigrants from Micronesia and percentage of family households in the United States with a correlation coefficient (R) of 0.037 and weighted average of 64.2%, a difference of 2.2%.
Family Households Correlation Summary
| Measurement | Australian | Immigrants from Micronesia |
| Minimum | 31.6% | 40.4% |
| Maximum | 82.4% | 84.1% |
| Range | 50.9% | 43.7% |
| Mean | 64.8% | 66.8% |
| Median | 64.9% | 66.1% |
| Interquartile 25% (IQ1) | 60.9% | 63.2% |
| Interquartile 75% (IQ3) | 70.5% | 72.3% |
| Interquartile Range (IQR) | 9.6% | 9.1% |
| Standard Deviation (Sample) | 9.3% | 8.9% |
| Standard Deviation (Population) | 9.2% | 8.8% |
Similar Demographics by Family Households
Demographics Similar to Australians by Family Households
In terms of family households, the demographic groups most similar to Australians are Immigrants from Denmark (62.9%, a difference of 0.040%), New Zealander (62.9%, a difference of 0.050%), Estonian (62.9%, a difference of 0.080%), Mongolian (62.8%, a difference of 0.10%), and British West Indian (62.8%, a difference of 0.13%).
| Demographics | Rating | Rank | Family Households |
| Ottawa | 0.3 /100 | #277 | Tragic 63.0% |
| Immigrants | Belgium | 0.2 /100 | #278 | Tragic 63.0% |
| Immigrants | Yemen | 0.2 /100 | #279 | Tragic 63.0% |
| Immigrants | Bulgaria | 0.2 /100 | #280 | Tragic 63.0% |
| Estonians | 0.2 /100 | #281 | Tragic 62.9% |
| New Zealanders | 0.1 /100 | #282 | Tragic 62.9% |
| Immigrants | Denmark | 0.1 /100 | #283 | Tragic 62.9% |
| Australians | 0.1 /100 | #284 | Tragic 62.8% |
| Mongolians | 0.1 /100 | #285 | Tragic 62.8% |
| British West Indians | 0.1 /100 | #286 | Tragic 62.8% |
| Latvians | 0.1 /100 | #287 | Tragic 62.8% |
| Immigrants | Uganda | 0.1 /100 | #288 | Tragic 62.7% |
| Immigrants | Nepal | 0.1 /100 | #289 | Tragic 62.7% |
| Immigrants | Grenada | 0.0 /100 | #290 | Tragic 62.6% |
| U.S. Virgin Islanders | 0.0 /100 | #291 | Tragic 62.6% |
Demographics Similar to Immigrants from Micronesia by Family Households
In terms of family households, the demographic groups most similar to Immigrants from Micronesia are Vietnamese (64.2%, a difference of 0.020%), Jamaican (64.2%, a difference of 0.020%), Bangladeshi (64.3%, a difference of 0.030%), Immigrants from Ukraine (64.2%, a difference of 0.060%), and Immigrants from Germany (64.3%, a difference of 0.10%).
| Demographics | Rating | Rank | Family Households |
| Armenians | 55.9 /100 | #170 | Average 64.4% |
| Ute | 54.6 /100 | #171 | Average 64.3% |
| Dutch West Indians | 53.9 /100 | #172 | Average 64.3% |
| Immigrants | Sierra Leone | 52.5 /100 | #173 | Average 64.3% |
| Immigrants | Germany | 50.0 /100 | #174 | Average 64.3% |
| Bangladeshis | 44.3 /100 | #175 | Average 64.3% |
| Vietnamese | 43.6 /100 | #176 | Average 64.2% |
| Immigrants | Micronesia | 42.3 /100 | #177 | Average 64.2% |
| Jamaicans | 40.6 /100 | #178 | Average 64.2% |
| Immigrants | Ukraine | 38.2 /100 | #179 | Fair 64.2% |
| Immigrants | Honduras | 35.0 /100 | #180 | Fair 64.2% |
| Immigrants | Trinidad and Tobago | 34.9 /100 | #181 | Fair 64.2% |
| Ukrainians | 34.6 /100 | #182 | Fair 64.2% |
| Creek | 34.1 /100 | #183 | Fair 64.2% |
| Puerto Ricans | 33.4 /100 | #184 | Fair 64.2% |