Basque vs Sudanese Family Households
COMPARE
Basque
Sudanese
Family Households
Family Households Comparison
Basques
Sudanese
64.7%
FAMILY HOUSEHOLDS
85.5/ 100
METRIC RATING
138th/ 347
METRIC RANK
60.0%
FAMILY HOUSEHOLDS
0.0/ 100
METRIC RATING
342nd/ 347
METRIC RANK
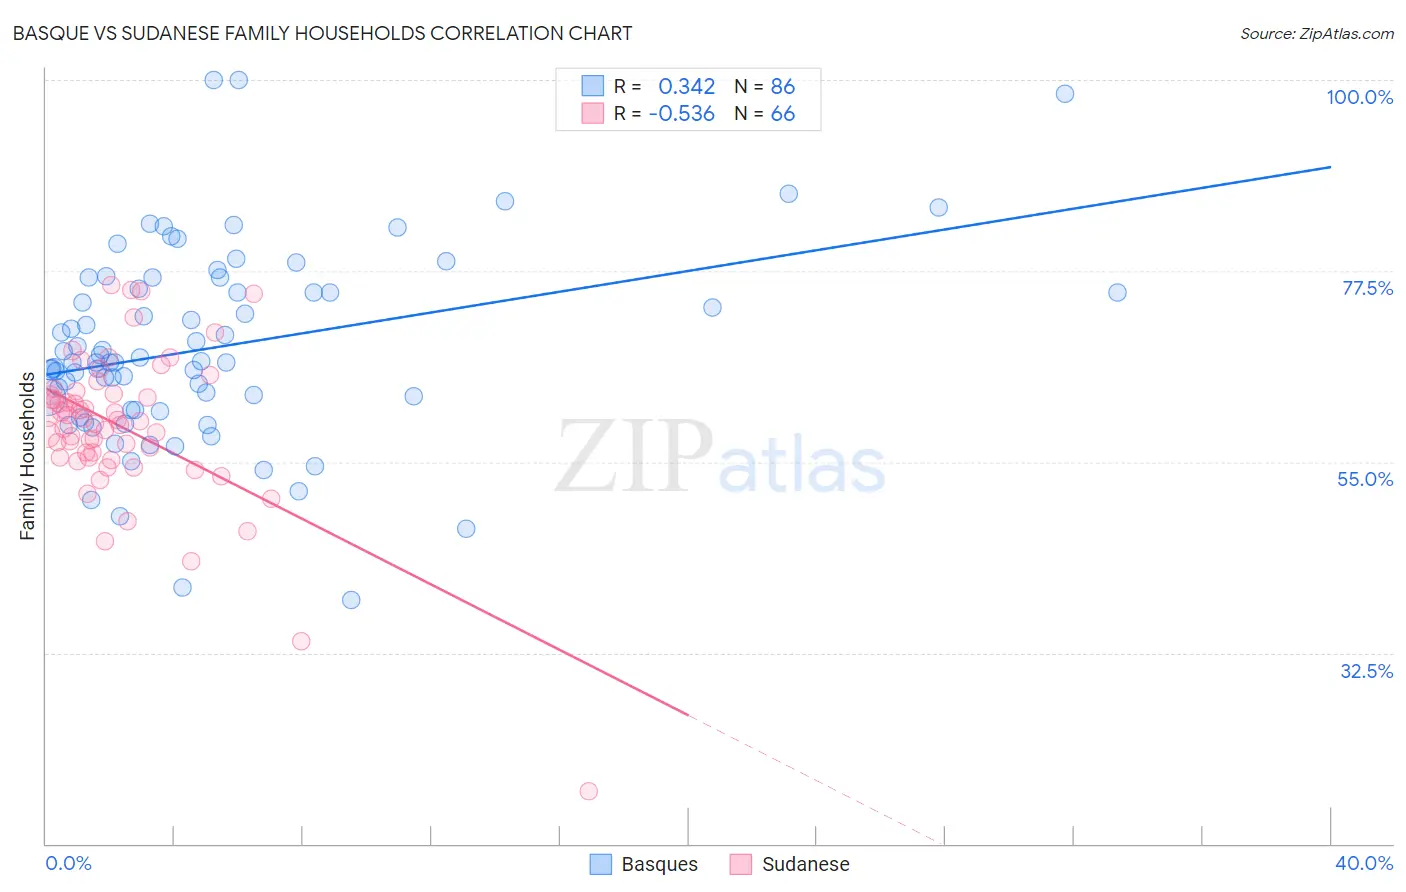
Basque vs Sudanese Family Households Correlation Chart
The statistical analysis conducted on geographies consisting of 165,752,297 people shows a mild positive correlation between the proportion of Basques and percentage of family households in the United States with a correlation coefficient (R) of 0.342 and weighted average of 64.7%. Similarly, the statistical analysis conducted on geographies consisting of 110,109,646 people shows a substantial negative correlation between the proportion of Sudanese and percentage of family households in the United States with a correlation coefficient (R) of -0.536 and weighted average of 60.0%, a difference of 7.8%.
Family Households Correlation Summary
| Measurement | Basque | Sudanese |
| Minimum | 38.8% | 16.3% |
| Maximum | 100.0% | 75.8% |
| Range | 61.2% | 59.6% |
| Mean | 68.5% | 59.1% |
| Median | 66.7% | 59.9% |
| Interquartile 25% (IQ1) | 61.1% | 55.6% |
| Interquartile 75% (IQ3) | 75.3% | 63.0% |
| Interquartile Range (IQR) | 14.3% | 7.4% |
| Standard Deviation (Sample) | 11.5% | 9.2% |
| Standard Deviation (Population) | 11.4% | 9.1% |
Similar Demographics by Family Households
Demographics Similar to Basques by Family Households
In terms of family households, the demographic groups most similar to Basques are Immigrants from Jamaica (64.7%, a difference of 0.010%), Immigrants from Scotland (64.7%, a difference of 0.020%), Immigrants from North Macedonia (64.7%, a difference of 0.020%), Immigrants from Cameroon (64.7%, a difference of 0.020%), and Immigrants from China (64.7%, a difference of 0.030%).
| Demographics | Rating | Rank | Family Households |
| Immigrants | Nonimmigrants | 90.1 /100 | #131 | Exceptional 64.8% |
| Cajuns | 89.4 /100 | #132 | Excellent 64.8% |
| Belizeans | 89.3 /100 | #133 | Excellent 64.8% |
| Greeks | 88.1 /100 | #134 | Excellent 64.7% |
| Maltese | 87.4 /100 | #135 | Excellent 64.7% |
| Immigrants | China | 86.6 /100 | #136 | Excellent 64.7% |
| Immigrants | Scotland | 86.4 /100 | #137 | Excellent 64.7% |
| Basques | 85.5 /100 | #138 | Excellent 64.7% |
| Immigrants | Jamaica | 85.3 /100 | #139 | Excellent 64.7% |
| Immigrants | North Macedonia | 84.9 /100 | #140 | Excellent 64.7% |
| Immigrants | Cameroon | 84.8 /100 | #141 | Excellent 64.7% |
| Pakistanis | 84.0 /100 | #142 | Excellent 64.7% |
| Czechoslovakians | 82.1 /100 | #143 | Excellent 64.6% |
| South American Indians | 81.9 /100 | #144 | Excellent 64.6% |
| Welsh | 80.1 /100 | #145 | Excellent 64.6% |
Demographics Similar to Sudanese by Family Households
In terms of family households, the demographic groups most similar to Sudanese are Immigrants from Senegal (60.1%, a difference of 0.18%), Immigrants from Sudan (60.2%, a difference of 0.27%), Senegalese (59.8%, a difference of 0.30%), Immigrants from Saudi Arabia (60.7%, a difference of 1.2%), and Immigrants from Congo (59.2%, a difference of 1.3%).
| Demographics | Rating | Rank | Family Households |
| Immigrants | Ethiopia | 0.0 /100 | #333 | Tragic 61.2% |
| Immigrants | Eastern Africa | 0.0 /100 | #334 | Tragic 61.1% |
| Carpatho Rusyns | 0.0 /100 | #335 | Tragic 61.1% |
| German Russians | 0.0 /100 | #336 | Tragic 60.9% |
| Soviet Union | 0.0 /100 | #337 | Tragic 60.9% |
| Immigrants | Eritrea | 0.0 /100 | #338 | Tragic 60.8% |
| Immigrants | Saudi Arabia | 0.0 /100 | #339 | Tragic 60.7% |
| Immigrants | Sudan | 0.0 /100 | #340 | Tragic 60.2% |
| Immigrants | Senegal | 0.0 /100 | #341 | Tragic 60.1% |
| Sudanese | 0.0 /100 | #342 | Tragic 60.0% |
| Senegalese | 0.0 /100 | #343 | Tragic 59.8% |
| Immigrants | Congo | 0.0 /100 | #344 | Tragic 59.2% |
| Immigrants | Zaire | 0.0 /100 | #345 | Tragic 59.2% |
| Somalis | 0.0 /100 | #346 | Tragic 57.6% |
| Immigrants | Somalia | 0.0 /100 | #347 | Tragic 56.7% |