Asian vs Immigrants from Micronesia Family Households
COMPARE
Asian
Immigrants from Micronesia
Family Households
Family Households Comparison
Asians
Immigrants from Micronesia
66.5%
FAMILY HOUSEHOLDS
100.0/ 100
METRIC RATING
44th/ 347
METRIC RANK
64.2%
FAMILY HOUSEHOLDS
42.3/ 100
METRIC RATING
177th/ 347
METRIC RANK
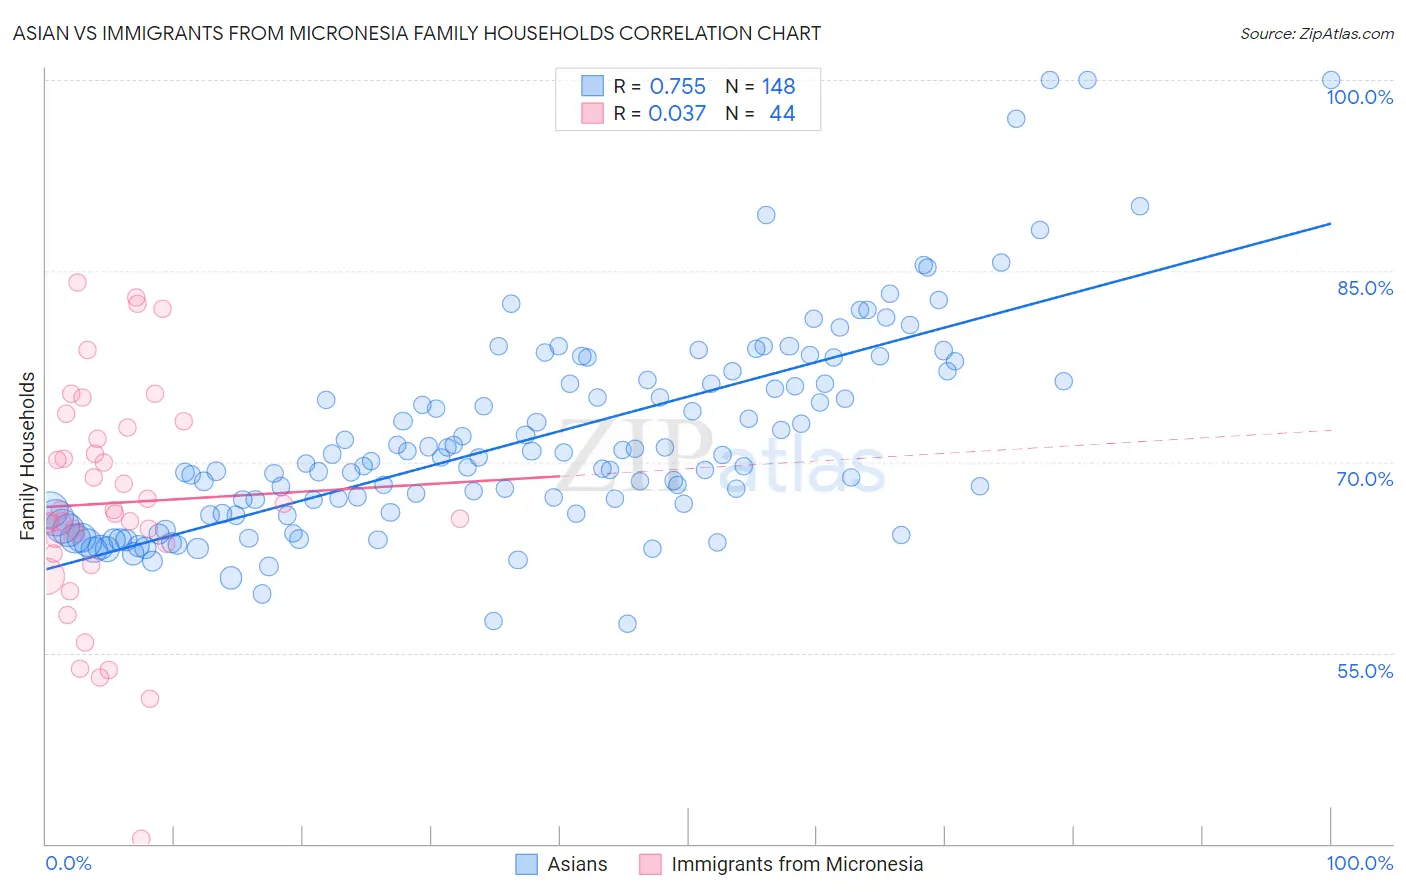
Asian vs Immigrants from Micronesia Family Households Correlation Chart
The statistical analysis conducted on geographies consisting of 550,272,164 people shows a strong positive correlation between the proportion of Asians and percentage of family households in the United States with a correlation coefficient (R) of 0.755 and weighted average of 66.5%. Similarly, the statistical analysis conducted on geographies consisting of 61,601,070 people shows no correlation between the proportion of Immigrants from Micronesia and percentage of family households in the United States with a correlation coefficient (R) of 0.037 and weighted average of 64.2%, a difference of 3.5%.
Family Households Correlation Summary
| Measurement | Asian | Immigrants from Micronesia |
| Minimum | 57.2% | 40.4% |
| Maximum | 100.0% | 84.1% |
| Range | 42.8% | 43.7% |
| Mean | 71.8% | 66.8% |
| Median | 70.0% | 66.1% |
| Interquartile 25% (IQ1) | 65.9% | 63.2% |
| Interquartile 75% (IQ3) | 76.2% | 72.3% |
| Interquartile Range (IQR) | 10.4% | 9.1% |
| Standard Deviation (Sample) | 8.1% | 8.9% |
| Standard Deviation (Population) | 8.1% | 8.8% |
Similar Demographics by Family Households
Demographics Similar to Asians by Family Households
In terms of family households, the demographic groups most similar to Asians are Venezuelan (66.5%, a difference of 0.020%), Apache (66.5%, a difference of 0.050%), Arapaho (66.5%, a difference of 0.050%), Menominee (66.5%, a difference of 0.060%), and Bolivian (66.5%, a difference of 0.070%).
| Demographics | Rating | Rank | Family Households |
| Tsimshian | 100.0 /100 | #37 | Exceptional 67.1% |
| Mexican American Indians | 100.0 /100 | #38 | Exceptional 67.0% |
| Immigrants | El Salvador | 100.0 /100 | #39 | Exceptional 67.0% |
| Guamanians/Chamorros | 100.0 /100 | #40 | Exceptional 66.6% |
| Immigrants | Bolivia | 100.0 /100 | #41 | Exceptional 66.6% |
| Menominee | 100.0 /100 | #42 | Exceptional 66.5% |
| Apache | 100.0 /100 | #43 | Exceptional 66.5% |
| Asians | 100.0 /100 | #44 | Exceptional 66.5% |
| Venezuelans | 100.0 /100 | #45 | Exceptional 66.5% |
| Arapaho | 100.0 /100 | #46 | Exceptional 66.5% |
| Bolivians | 100.0 /100 | #47 | Exceptional 66.5% |
| Immigrants | Venezuela | 100.0 /100 | #48 | Exceptional 66.4% |
| Immigrants | South Central Asia | 100.0 /100 | #49 | Exceptional 66.4% |
| Navajo | 100.0 /100 | #50 | Exceptional 66.4% |
| Natives/Alaskans | 100.0 /100 | #51 | Exceptional 66.4% |
Demographics Similar to Immigrants from Micronesia by Family Households
In terms of family households, the demographic groups most similar to Immigrants from Micronesia are Vietnamese (64.2%, a difference of 0.020%), Jamaican (64.2%, a difference of 0.020%), Bangladeshi (64.3%, a difference of 0.030%), Immigrants from Ukraine (64.2%, a difference of 0.060%), and Immigrants from Germany (64.3%, a difference of 0.10%).
| Demographics | Rating | Rank | Family Households |
| Armenians | 55.9 /100 | #170 | Average 64.4% |
| Ute | 54.6 /100 | #171 | Average 64.3% |
| Dutch West Indians | 53.9 /100 | #172 | Average 64.3% |
| Immigrants | Sierra Leone | 52.5 /100 | #173 | Average 64.3% |
| Immigrants | Germany | 50.0 /100 | #174 | Average 64.3% |
| Bangladeshis | 44.3 /100 | #175 | Average 64.3% |
| Vietnamese | 43.6 /100 | #176 | Average 64.2% |
| Immigrants | Micronesia | 42.3 /100 | #177 | Average 64.2% |
| Jamaicans | 40.6 /100 | #178 | Average 64.2% |
| Immigrants | Ukraine | 38.2 /100 | #179 | Fair 64.2% |
| Immigrants | Honduras | 35.0 /100 | #180 | Fair 64.2% |
| Immigrants | Trinidad and Tobago | 34.9 /100 | #181 | Fair 64.2% |
| Ukrainians | 34.6 /100 | #182 | Fair 64.2% |
| Creek | 34.1 /100 | #183 | Fair 64.2% |
| Puerto Ricans | 33.4 /100 | #184 | Fair 64.2% |