Basque vs German Family Households

COMPARE

Basque
Race
Ancestry
AfghanAfricanAlaska NativeAlaskan AthabascanAlbanianAleutAlsatianAmericanApacheArabArapahoArgentineanArmenianAssyrian/Chaldean/SyriacAustralianAustrianBahamianBangladeshiBarbadianBasqueBelgianBelizeanBermudanBhutaneseBlackfeetBolivianBrazilianBritishBritish West IndianBulgarianBurmeseCajunCambodianCanadianCape VerdeanCarpatho RusynCelticCentral AmericanCentral American IndianCherokeeCheyenneChickasawChileanChineseChippewaChoctawColombianColvilleComancheCosta RicanCreeCreekCroatianCrowCubanCypriotCzechCzechoslovakianDanishDelawareDominicanDutchDutch West IndianEastern EuropeanEcuadorianEgyptianEnglishEstonianEthiopianEuropeanFijianFilipinoFinnishFrenchFrench American IndianFrench CanadianGerman RussianGhanaianGreekGuamanian/ChamorroGuatemalanGuyaneseHaitianHmongHonduranHopiHoumaHungarianIcelanderIndian (Asian)IndonesianInupiatIranianIraqiIrishIroquoisIsraeliItalianJamaicanJapaneseJordanianKenyanKiowaKoreanLaotianLatvianLebaneseLiberianLithuanianLumbeeLuxembourgerMacedonianMalaysianMalteseMarshalleseMenomineeMexicanMexican American IndianMongolianMoroccanNative HawaiianNavajoNepaleseNew ZealanderNicaraguanNigerianNorthern EuropeanNorwegianOkinawanOsageOttawaPaiutePakistaniPalestinianPanamanianParaguayanPennsylvania GermanPeruvianPimaPolishPortuguesePotawatomiPuebloPuerto RicanPuget Sound SalishRomanianRussianSalvadoranSamoanScandinavianScotch-IrishScottishSeminoleSenegaleseSerbianShoshoneSierra LeoneanSiouxSlavicSlovakSloveneSomaliSouth AfricanSouth AmericanSouth American IndianSoviet UnionSpaniardSpanishSpanish AmericanSpanish American IndianSri LankanSubsaharan AfricanSudaneseSwedishSwissSyrianTaiwaneseThaiTlingit-HaidaTohono O'OdhamTonganTrinidadian and TobagonianTsimshianTurkishU.S. Virgin IslanderUgandanUkrainianUruguayanUteVenezuelanVietnameseWelshWest IndianYakamaYaquiYugoslavianYumanYup'ikZimbabwean
Immigration
NonimmigrantsImmigrantsAfghanistanAfricaAlbaniaArgentinaArmeniaAsiaAustraliaAustriaBahamasBangladeshBarbadosBelarusBelgiumBelizeBoliviaBosnia and HerzegovinaBrazilBulgariaBurma/MyanmarCabo VerdeCambodiaCameroonCanadaCaribbeanCentral AmericaChileChinaColombiaCongoCosta RicaCroatiaCubaCzechoslovakiaDenmarkDominicaDominican RepublicEastern AfricaEastern AsiaEastern EuropeEcuadorEgyptEl SalvadorEnglandEritreaEthiopiaEuropeFijiFranceGermanyGhanaGreeceGrenadaGuatemalaGuyanaHaitiHondurasHong KongHungaryIndiaIndonesiaIranIraqIrelandIsraelItalyJamaicaJapanJordanKazakhstanKenyaKoreaKuwaitLaosLatin AmericaLatviaLebanonLiberiaLithuaniaMalaysiaMexicoMicronesiaMiddle AfricaMoldovaMoroccoNepalNetherlandsNicaraguaNigeriaNorth AmericaNorth MacedoniaNorthern AfricaNorthern EuropeNorwayOceaniaPakistanPanamaPeruPhilippinesPolandPortugalRomaniaRussiaSaudi ArabiaScotlandSenegalSerbiaSierra LeoneSingaporeSomaliaSouth AfricaSouth AmericaSouth Central AsiaSouth Eastern AsiaSouthern EuropeSpainSri LankaSt. Vincent and the GrenadinesSudanSwedenSwitzerlandSyriaTaiwanThailandTrinidad and TobagoTurkeyUgandaUkraineUruguayUzbekistanVenezuelaVietnamWest IndiesWestern AfricaWestern AsiaWestern EuropeYemenZaireZimbabweAzores
German
Race
Ancestry
AfghanAfricanAlaska NativeAlaskan AthabascanAlbanianAleutAlsatianAmericanApacheArabArapahoArgentineanArmenianAssyrian/Chaldean/SyriacAustralianAustrianBahamianBangladeshiBarbadianBelgianBelizeanBermudanBhutaneseBlackfeetBolivianBrazilianBritishBritish West IndianBulgarianBurmeseCajunCambodianCanadianCape VerdeanCarpatho RusynCelticCentral AmericanCentral American IndianCherokeeCheyenneChickasawChileanChineseChippewaChoctawColombianColvilleComancheCosta RicanCreeCreekCroatianCrowCubanCypriotCzechCzechoslovakianDanishDelawareDominicanDutchDutch West IndianEastern EuropeanEcuadorianEgyptianEnglishEstonianEthiopianEuropeanFijianFilipinoFinnishFrenchFrench American IndianFrench CanadianGermanGerman RussianGhanaianGreekGuamanian/ChamorroGuatemalanGuyaneseHaitianHmongHonduranHopiHoumaHungarianIcelanderIndian (Asian)IndonesianInupiatIranianIraqiIrishIroquoisIsraeliItalianJamaicanJapaneseJordanianKenyanKiowaKoreanLaotianLatvianLebaneseLiberianLithuanianLumbeeLuxembourgerMacedonianMalaysianMalteseMarshalleseMenomineeMexicanMexican American IndianMongolianMoroccanNative HawaiianNavajoNepaleseNew ZealanderNicaraguanNigerianNorthern EuropeanNorwegianOkinawanOsageOttawaPaiutePakistaniPalestinianPanamanianParaguayanPennsylvania GermanPeruvianPimaPolishPortuguesePotawatomiPuebloPuerto RicanPuget Sound SalishRomanianRussianSalvadoranSamoanScandinavianScotch-IrishScottishSeminoleSenegaleseSerbianShoshoneSierra LeoneanSiouxSlavicSlovakSloveneSomaliSouth AfricanSouth AmericanSouth American IndianSoviet UnionSpaniardSpanishSpanish AmericanSpanish American IndianSri LankanSubsaharan AfricanSudaneseSwedishSwissSyrianTaiwaneseThaiTlingit-HaidaTohono O'OdhamTonganTrinidadian and TobagonianTsimshianTurkishU.S. Virgin IslanderUgandanUkrainianUruguayanUteVenezuelanVietnameseWelshWest IndianYakamaYaquiYugoslavianYumanYup'ikZimbabwean
Immigration
NonimmigrantsImmigrantsAfghanistanAfricaAlbaniaArgentinaArmeniaAsiaAustraliaAustriaBahamasBangladeshBarbadosBelarusBelgiumBelizeBoliviaBosnia and HerzegovinaBrazilBulgariaBurma/MyanmarCabo VerdeCambodiaCameroonCanadaCaribbeanCentral AmericaChileChinaColombiaCongoCosta RicaCroatiaCubaCzechoslovakiaDenmarkDominicaDominican RepublicEastern AfricaEastern AsiaEastern EuropeEcuadorEgyptEl SalvadorEnglandEritreaEthiopiaEuropeFijiFranceGermanyGhanaGreeceGrenadaGuatemalaGuyanaHaitiHondurasHong KongHungaryIndiaIndonesiaIranIraqIrelandIsraelItalyJamaicaJapanJordanKazakhstanKenyaKoreaKuwaitLaosLatin AmericaLatviaLebanonLiberiaLithuaniaMalaysiaMexicoMicronesiaMiddle AfricaMoldovaMoroccoNepalNetherlandsNicaraguaNigeriaNorth AmericaNorth MacedoniaNorthern AfricaNorthern EuropeNorwayOceaniaPakistanPanamaPeruPhilippinesPolandPortugalRomaniaRussiaSaudi ArabiaScotlandSenegalSerbiaSierra LeoneSingaporeSomaliaSouth AfricaSouth AmericaSouth Central AsiaSouth Eastern AsiaSouthern EuropeSpainSri LankaSt. Vincent and the GrenadinesSudanSwedenSwitzerlandSyriaTaiwanThailandTrinidad and TobagoTurkeyUgandaUkraineUruguayUzbekistanVenezuelaVietnamWest IndiesWestern AfricaWestern AsiaWestern EuropeYemenZaireZimbabweAzores
Family Households
Income
Poverty
Unemployment
Labor Participation
Family Structure
Vehicle Availability
Education Level
Disability

Family Households Comparison

Basques

Germans

Excellent
Good
64.7%
FAMILY HOUSEHOLDS
85.5/ 100
METRIC RATING
138th/ 347
METRIC RANK
64.4%
FAMILY HOUSEHOLDS
65.8/ 100
METRIC RATING
159th/ 347
METRIC RANK

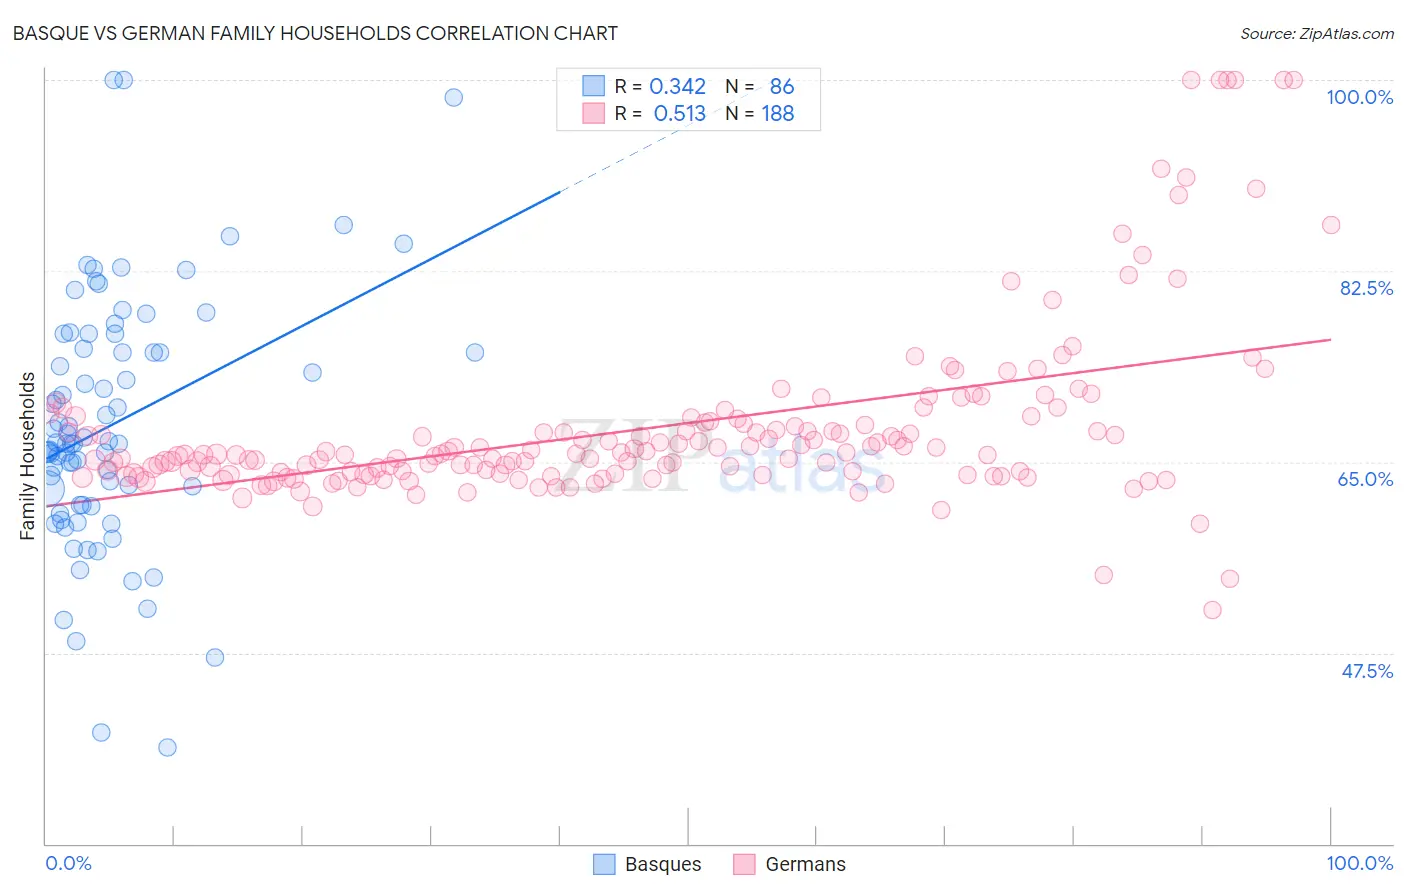
Basque vs German Family Households Correlation Chart

The statistical analysis conducted on geographies consisting of 165,752,297 people shows a mild positive correlation between the proportion of Basques and percentage of family households in the United States with a correlation coefficient (R) of 0.342 and weighted average of 64.7%. Similarly, the statistical analysis conducted on geographies consisting of 580,609,417 people shows a substantial positive correlation between the proportion of Germans and percentage of family households in the United States with a correlation coefficient (R) of 0.513 and weighted average of 64.4%, a difference of 0.38%.
Basque vs German Family Households

Family Households Correlation Summary

MeasurementBasqueGerman
Minimum38.8%51.4%
Maximum100.0%100.0%
Range61.2%48.6%
Mean68.5%68.1%
Median66.7%65.7%
Interquartile 25% (IQ1)61.1%63.9%
Interquartile 75% (IQ3)75.3%68.5%
Interquartile Range (IQR)14.3%4.7%
Standard Deviation (Sample)11.5%8.2%
Standard Deviation (Population)11.4%8.2%

Similar Demographics by Family Households

Demographics Similar to Basques by Family Households

In terms of family households, the demographic groups most similar to Basques are Immigrants from Jamaica (64.7%, a difference of 0.010%), Immigrants from Scotland (64.7%, a difference of 0.020%), Immigrants from North Macedonia (64.7%, a difference of 0.020%), Immigrants from Cameroon (64.7%, a difference of 0.020%), and Immigrants from China (64.7%, a difference of 0.030%).
DemographicsRating | RankFamily Households
Immigrants | Nonimmigrants
90.1
/100
|
#131
Exceptional
64.8%
Cajuns
89.4
/100
|
#132
Excellent
64.8%
Belizeans
89.3
/100
|
#133
Excellent
64.8%
Greeks
88.1
/100
|
#134
Excellent
64.7%
Maltese
87.4
/100
|
#135
Excellent
64.7%
Immigrants | China
86.6
/100
|
#136
Excellent
64.7%
Immigrants | Scotland
86.4
/100
|
#137
Excellent
64.7%
Basques
85.5
/100
|
#138
Excellent
64.7%
Immigrants | Jamaica
85.3
/100
|
#139
Excellent
64.7%
Immigrants | North Macedonia
84.9
/100
|
#140
Excellent
64.7%
Immigrants | Cameroon
84.8
/100
|
#141
Excellent
64.7%
Pakistanis
84.0
/100
|
#142
Excellent
64.7%
Czechoslovakians
82.1
/100
|
#143
Excellent
64.6%
South American Indians
81.9
/100
|
#144
Excellent
64.6%
Welsh
80.1
/100
|
#145
Excellent
64.6%

Demographics Similar to Germans by Family Households

In terms of family households, the demographic groups most similar to Germans are Canadian (64.4%, a difference of 0.010%), Lebanese (64.4%, a difference of 0.010%), Immigrants from Moldova (64.4%, a difference of 0.010%), Czech (64.5%, a difference of 0.020%), and Uruguayan (64.5%, a difference of 0.030%).
DemographicsRating | RankFamily Households
Scottish
70.9
/100
|
#152
Good
64.5%
Swedes
69.8
/100
|
#153
Good
64.5%
Austrians
68.5
/100
|
#154
Good
64.5%
Uruguayans
67.7
/100
|
#155
Good
64.5%
Czechs
67.0
/100
|
#156
Good
64.5%
Canadians
66.6
/100
|
#157
Good
64.4%
Lebanese
66.4
/100
|
#158
Good
64.4%
Germans
65.8
/100
|
#159
Good
64.4%
Immigrants | Moldova
65.2
/100
|
#160
Good
64.4%
Immigrants | England
62.6
/100
|
#161
Good
64.4%
British
61.6
/100
|
#162
Good
64.4%
Chickasaw
61.5
/100
|
#163
Good
64.4%
Immigrants | Nigeria
60.1
/100
|
#164
Good
64.4%
Immigrants | Southern Europe
60.0
/100
|
#165
Good
64.4%
Scotch-Irish
59.2
/100
|
#166
Average
64.4%