Basque vs South American Family Households
COMPARE
Basque
South American
Family Households
Family Households Comparison
Basques
South Americans
64.7%
FAMILY HOUSEHOLDS
85.5/ 100
METRIC RATING
138th/ 347
METRIC RANK
66.0%
FAMILY HOUSEHOLDS
100.0/ 100
METRIC RATING
60th/ 347
METRIC RANK
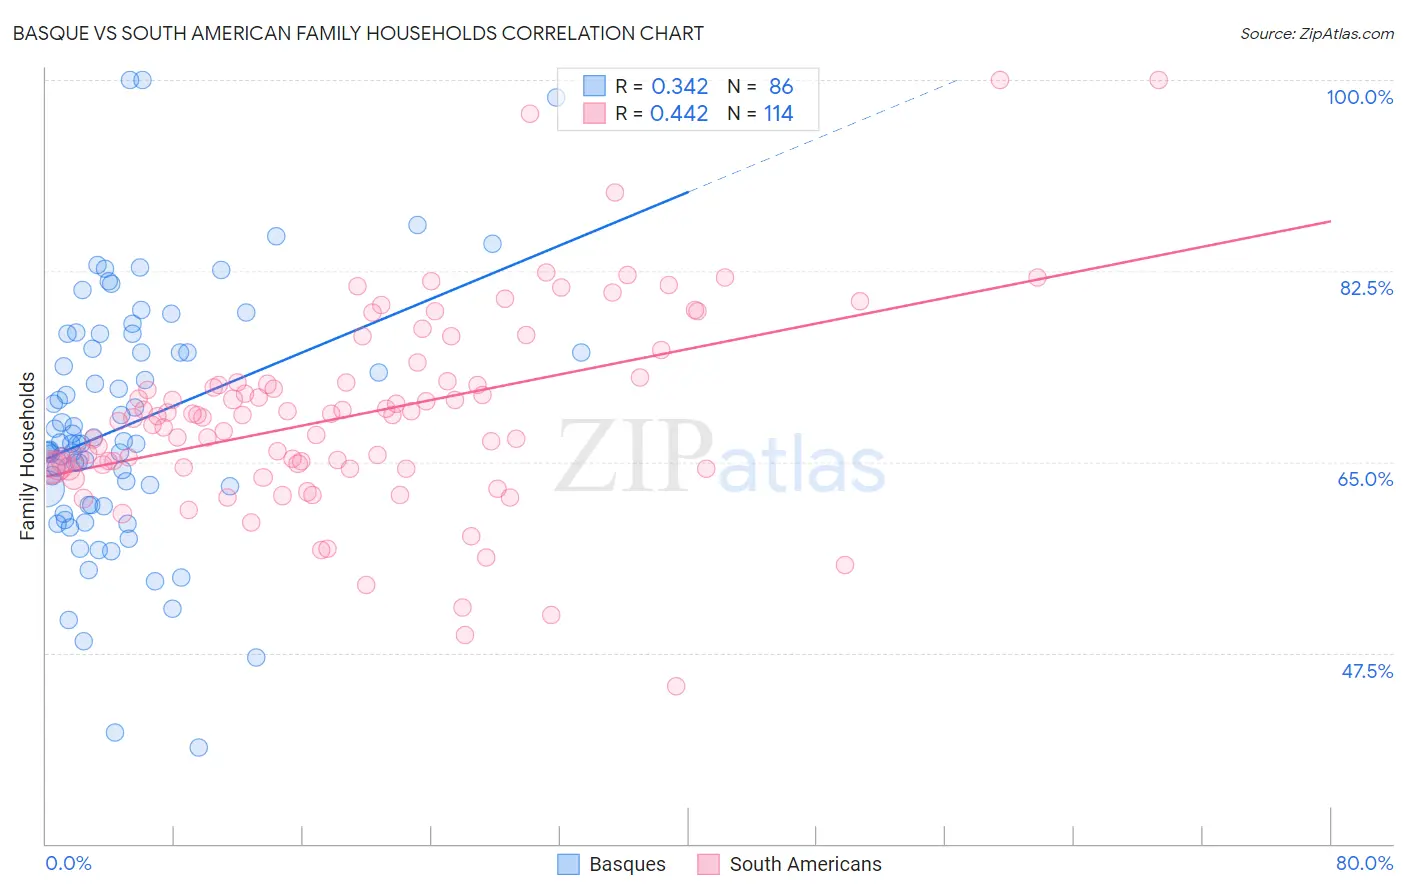
Basque vs South American Family Households Correlation Chart
The statistical analysis conducted on geographies consisting of 165,752,297 people shows a mild positive correlation between the proportion of Basques and percentage of family households in the United States with a correlation coefficient (R) of 0.342 and weighted average of 64.7%. Similarly, the statistical analysis conducted on geographies consisting of 493,649,007 people shows a moderate positive correlation between the proportion of South Americans and percentage of family households in the United States with a correlation coefficient (R) of 0.442 and weighted average of 66.0%, a difference of 2.1%.
Family Households Correlation Summary
| Measurement | Basque | South American |
| Minimum | 38.8% | 44.4% |
| Maximum | 100.0% | 100.0% |
| Range | 61.2% | 55.6% |
| Mean | 68.5% | 69.3% |
| Median | 66.7% | 69.1% |
| Interquartile 25% (IQ1) | 61.1% | 64.5% |
| Interquartile 75% (IQ3) | 75.3% | 72.3% |
| Interquartile Range (IQR) | 14.3% | 7.8% |
| Standard Deviation (Sample) | 11.5% | 9.1% |
| Standard Deviation (Population) | 11.4% | 9.1% |
Similar Demographics by Family Households
Demographics Similar to Basques by Family Households
In terms of family households, the demographic groups most similar to Basques are Immigrants from Jamaica (64.7%, a difference of 0.010%), Immigrants from Scotland (64.7%, a difference of 0.020%), Immigrants from North Macedonia (64.7%, a difference of 0.020%), Immigrants from Cameroon (64.7%, a difference of 0.020%), and Immigrants from China (64.7%, a difference of 0.030%).
| Demographics | Rating | Rank | Family Households |
| Immigrants | Nonimmigrants | 90.1 /100 | #131 | Exceptional 64.8% |
| Cajuns | 89.4 /100 | #132 | Excellent 64.8% |
| Belizeans | 89.3 /100 | #133 | Excellent 64.8% |
| Greeks | 88.1 /100 | #134 | Excellent 64.7% |
| Maltese | 87.4 /100 | #135 | Excellent 64.7% |
| Immigrants | China | 86.6 /100 | #136 | Excellent 64.7% |
| Immigrants | Scotland | 86.4 /100 | #137 | Excellent 64.7% |
| Basques | 85.5 /100 | #138 | Excellent 64.7% |
| Immigrants | Jamaica | 85.3 /100 | #139 | Excellent 64.7% |
| Immigrants | North Macedonia | 84.9 /100 | #140 | Excellent 64.7% |
| Immigrants | Cameroon | 84.8 /100 | #141 | Excellent 64.7% |
| Pakistanis | 84.0 /100 | #142 | Excellent 64.7% |
| Czechoslovakians | 82.1 /100 | #143 | Excellent 64.6% |
| South American Indians | 81.9 /100 | #144 | Excellent 64.6% |
| Welsh | 80.1 /100 | #145 | Excellent 64.6% |
Demographics Similar to South Americans by Family Households
In terms of family households, the demographic groups most similar to South Americans are Immigrants from Korea (66.0%, a difference of 0.010%), Danish (66.0%, a difference of 0.020%), Immigrants from Asia (66.1%, a difference of 0.030%), Central American (66.0%, a difference of 0.050%), and Immigrants from Indonesia (66.0%, a difference of 0.090%).
| Demographics | Rating | Rank | Family Households |
| Afghans | 100.0 /100 | #53 | Exceptional 66.3% |
| Immigrants | Colombia | 100.0 /100 | #54 | Exceptional 66.3% |
| Immigrants | Immigrants | 100.0 /100 | #55 | Exceptional 66.1% |
| Immigrants | Hong Kong | 100.0 /100 | #56 | Exceptional 66.1% |
| Pennsylvania Germans | 100.0 /100 | #57 | Exceptional 66.1% |
| Immigrants | Asia | 100.0 /100 | #58 | Exceptional 66.1% |
| Immigrants | Korea | 100.0 /100 | #59 | Exceptional 66.0% |
| South Americans | 100.0 /100 | #60 | Exceptional 66.0% |
| Danes | 100.0 /100 | #61 | Exceptional 66.0% |
| Central Americans | 100.0 /100 | #62 | Exceptional 66.0% |
| Immigrants | Indonesia | 100.0 /100 | #63 | Exceptional 66.0% |
| Pima | 99.9 /100 | #64 | Exceptional 65.9% |
| Costa Ricans | 99.9 /100 | #65 | Exceptional 65.9% |
| Fijians | 99.9 /100 | #66 | Exceptional 65.9% |
| Filipinos | 99.9 /100 | #67 | Exceptional 65.9% |