Argentinean vs Macedonian Average Family Size
COMPARE
Argentinean
Macedonian
Average Family Size
Average Family Size Comparison
Argentineans
Macedonians
3.23
AVERAGE FAMILY SIZE
47.4/ 100
METRIC RATING
177th/ 347
METRIC RANK
3.13
AVERAGE FAMILY SIZE
0.2/ 100
METRIC RATING
301st/ 347
METRIC RANK
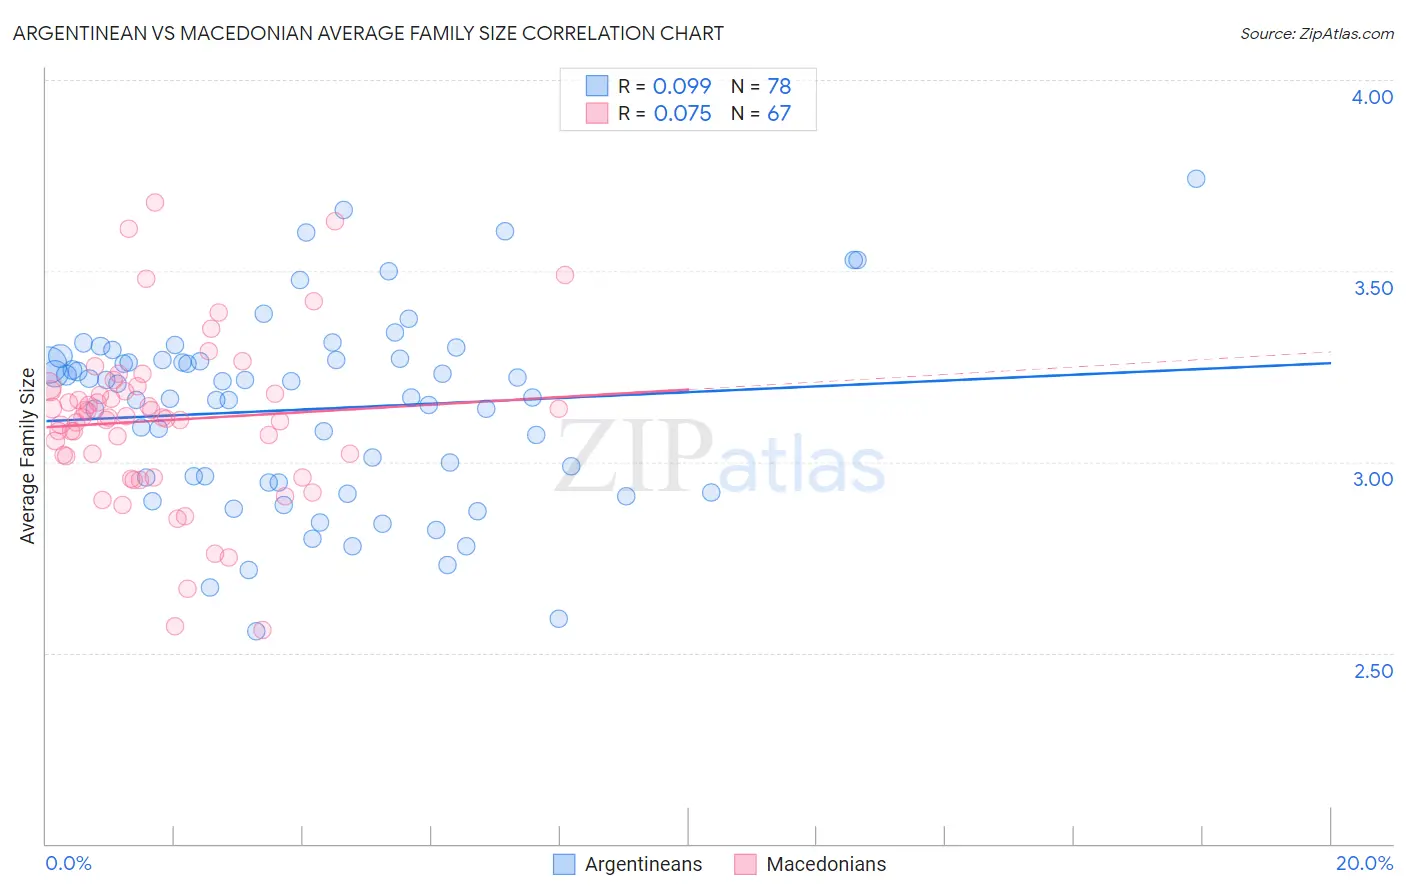
Argentinean vs Macedonian Average Family Size Correlation Chart
The statistical analysis conducted on geographies consisting of 296,996,433 people shows a slight positive correlation between the proportion of Argentineans and average family size in the United States with a correlation coefficient (R) of 0.099 and weighted average of 3.23. Similarly, the statistical analysis conducted on geographies consisting of 132,621,660 people shows a slight positive correlation between the proportion of Macedonians and average family size in the United States with a correlation coefficient (R) of 0.075 and weighted average of 3.13, a difference of 2.9%.
Average Family Size Correlation Summary
| Measurement | Argentinean | Macedonian |
| Minimum | 2.56 | 2.56 |
| Maximum | 3.74 | 3.68 |
| Range | 1.18 | 1.12 |
| Mean | 3.14 | 3.11 |
| Median | 3.19 | 3.12 |
| Interquartile 25% (IQ1) | 2.95 | 3.02 |
| Interquartile 75% (IQ3) | 3.27 | 3.19 |
| Interquartile Range (IQR) | 0.32 | 0.17 |
| Standard Deviation (Sample) | 0.25 | 0.21 |
| Standard Deviation (Population) | 0.25 | 0.21 |
Similar Demographics by Average Family Size
Demographics Similar to Argentineans by Average Family Size
In terms of average family size, the demographic groups most similar to Argentineans are Spaniard (3.23, a difference of 0.0%), Immigrants from Korea (3.23, a difference of 0.010%), Palestinian (3.23, a difference of 0.010%), Israeli (3.23, a difference of 0.020%), and Immigrants from South Central Asia (3.23, a difference of 0.050%).
| Demographics | Rating | Rank | Average Family Size |
| Arabs | 53.8 /100 | #170 | Average 3.23 |
| Chileans | 53.2 /100 | #171 | Average 3.23 |
| Immigrants | Congo | 52.7 /100 | #172 | Average 3.23 |
| Immigrants | Uruguay | 52.0 /100 | #173 | Average 3.23 |
| Immigrants | South Central Asia | 50.0 /100 | #174 | Average 3.23 |
| Immigrants | China | 49.9 /100 | #175 | Average 3.23 |
| Israelis | 48.7 /100 | #176 | Average 3.23 |
| Argentineans | 47.4 /100 | #177 | Average 3.23 |
| Spaniards | 47.2 /100 | #178 | Average 3.23 |
| Immigrants | Korea | 46.9 /100 | #179 | Average 3.23 |
| Palestinians | 46.6 /100 | #180 | Average 3.23 |
| Spanish | 44.8 /100 | #181 | Average 3.23 |
| Moroccans | 44.2 /100 | #182 | Average 3.22 |
| Immigrants | Northern Africa | 41.7 /100 | #183 | Average 3.22 |
| Immigrants | Eastern Asia | 40.8 /100 | #184 | Average 3.22 |
Demographics Similar to Macedonians by Average Family Size
In terms of average family size, the demographic groups most similar to Macedonians are Immigrants from Latvia (3.13, a difference of 0.0%), British (3.13, a difference of 0.010%), Immigrants from Switzerland (3.13, a difference of 0.030%), Australian (3.13, a difference of 0.060%), and Immigrants from Sweden (3.14, a difference of 0.070%).
| Demographics | Rating | Rank | Average Family Size |
| Immigrants | Croatia | 0.2 /100 | #294 | Tragic 3.14 |
| Austrians | 0.2 /100 | #295 | Tragic 3.14 |
| Ukrainians | 0.2 /100 | #296 | Tragic 3.14 |
| Immigrants | Western Europe | 0.2 /100 | #297 | Tragic 3.14 |
| Colville | 0.2 /100 | #298 | Tragic 3.14 |
| Canadians | 0.2 /100 | #299 | Tragic 3.14 |
| Immigrants | Sweden | 0.2 /100 | #300 | Tragic 3.14 |
| Macedonians | 0.2 /100 | #301 | Tragic 3.13 |
| Immigrants | Latvia | 0.2 /100 | #302 | Tragic 3.13 |
| British | 0.2 /100 | #303 | Tragic 3.13 |
| Immigrants | Switzerland | 0.2 /100 | #304 | Tragic 3.13 |
| Australians | 0.1 /100 | #305 | Tragic 3.13 |
| Immigrants | Ireland | 0.1 /100 | #306 | Tragic 3.13 |
| Immigrants | Serbia | 0.1 /100 | #307 | Tragic 3.13 |
| Slavs | 0.1 /100 | #308 | Tragic 3.13 |