Iranian vs Macedonian Average Family Size
COMPARE
Iranian
Macedonian
Average Family Size
Average Family Size Comparison
Iranians
Macedonians
3.18
AVERAGE FAMILY SIZE
4.5/ 100
METRIC RATING
234th/ 347
METRIC RANK
3.13
AVERAGE FAMILY SIZE
0.2/ 100
METRIC RATING
301st/ 347
METRIC RANK
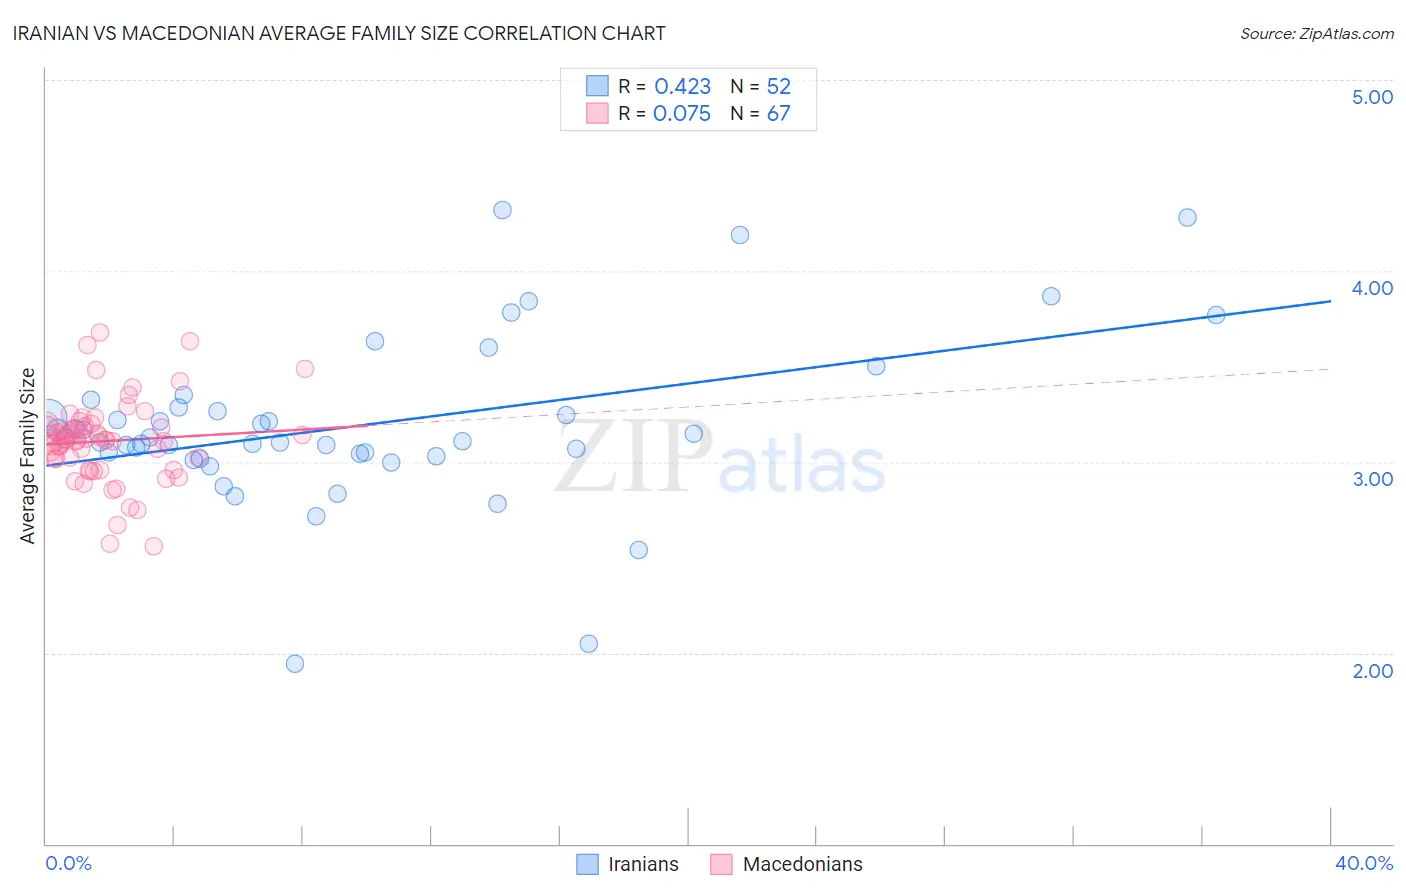
Iranian vs Macedonian Average Family Size Correlation Chart
The statistical analysis conducted on geographies consisting of 316,654,945 people shows a moderate positive correlation between the proportion of Iranians and average family size in the United States with a correlation coefficient (R) of 0.423 and weighted average of 3.18. Similarly, the statistical analysis conducted on geographies consisting of 132,621,660 people shows a slight positive correlation between the proportion of Macedonians and average family size in the United States with a correlation coefficient (R) of 0.075 and weighted average of 3.13, a difference of 1.6%.
Average Family Size Correlation Summary
| Measurement | Iranian | Macedonian |
| Minimum | 1.94 | 2.56 |
| Maximum | 4.32 | 3.68 |
| Range | 2.38 | 1.12 |
| Mean | 3.19 | 3.11 |
| Median | 3.12 | 3.12 |
| Interquartile 25% (IQ1) | 3.04 | 3.02 |
| Interquartile 75% (IQ3) | 3.27 | 3.19 |
| Interquartile Range (IQR) | 0.24 | 0.17 |
| Standard Deviation (Sample) | 0.44 | 0.21 |
| Standard Deviation (Population) | 0.44 | 0.21 |
Similar Demographics by Average Family Size
Demographics Similar to Iranians by Average Family Size
In terms of average family size, the demographic groups most similar to Iranians are Brazilian (3.18, a difference of 0.0%), Immigrants from Turkey (3.18, a difference of 0.020%), Cherokee (3.18, a difference of 0.030%), Immigrants from Portugal (3.18, a difference of 0.030%), and Icelander (3.19, a difference of 0.070%).
| Demographics | Rating | Rank | Average Family Size |
| Portuguese | 6.0 /100 | #227 | Tragic 3.19 |
| Immigrants | Nonimmigrants | 5.7 /100 | #228 | Tragic 3.19 |
| Immigrants | Italy | 5.3 /100 | #229 | Tragic 3.19 |
| Icelanders | 5.2 /100 | #230 | Tragic 3.19 |
| Basques | 5.2 /100 | #231 | Tragic 3.19 |
| Cherokee | 4.7 /100 | #232 | Tragic 3.18 |
| Brazilians | 4.5 /100 | #233 | Tragic 3.18 |
| Iranians | 4.5 /100 | #234 | Tragic 3.18 |
| Immigrants | Turkey | 4.2 /100 | #235 | Tragic 3.18 |
| Immigrants | Portugal | 4.2 /100 | #236 | Tragic 3.18 |
| Immigrants | Romania | 3.7 /100 | #237 | Tragic 3.18 |
| Romanians | 3.7 /100 | #238 | Tragic 3.18 |
| Houma | 3.4 /100 | #239 | Tragic 3.18 |
| Osage | 3.2 /100 | #240 | Tragic 3.18 |
| Immigrants | Japan | 3.0 /100 | #241 | Tragic 3.18 |
Demographics Similar to Macedonians by Average Family Size
In terms of average family size, the demographic groups most similar to Macedonians are Immigrants from Latvia (3.13, a difference of 0.0%), British (3.13, a difference of 0.010%), Immigrants from Switzerland (3.13, a difference of 0.030%), Australian (3.13, a difference of 0.060%), and Immigrants from Sweden (3.14, a difference of 0.070%).
| Demographics | Rating | Rank | Average Family Size |
| Immigrants | Croatia | 0.2 /100 | #294 | Tragic 3.14 |
| Austrians | 0.2 /100 | #295 | Tragic 3.14 |
| Ukrainians | 0.2 /100 | #296 | Tragic 3.14 |
| Immigrants | Western Europe | 0.2 /100 | #297 | Tragic 3.14 |
| Colville | 0.2 /100 | #298 | Tragic 3.14 |
| Canadians | 0.2 /100 | #299 | Tragic 3.14 |
| Immigrants | Sweden | 0.2 /100 | #300 | Tragic 3.14 |
| Macedonians | 0.2 /100 | #301 | Tragic 3.13 |
| Immigrants | Latvia | 0.2 /100 | #302 | Tragic 3.13 |
| British | 0.2 /100 | #303 | Tragic 3.13 |
| Immigrants | Switzerland | 0.2 /100 | #304 | Tragic 3.13 |
| Australians | 0.1 /100 | #305 | Tragic 3.13 |
| Immigrants | Ireland | 0.1 /100 | #306 | Tragic 3.13 |
| Immigrants | Serbia | 0.1 /100 | #307 | Tragic 3.13 |
| Slavs | 0.1 /100 | #308 | Tragic 3.13 |