Swedish vs Macedonian Average Family Size
COMPARE
Swedish
Macedonian
Average Family Size
Average Family Size Comparison
Swedes
Macedonians
3.10
AVERAGE FAMILY SIZE
0.0/ 100
METRIC RATING
337th/ 347
METRIC RANK
3.13
AVERAGE FAMILY SIZE
0.2/ 100
METRIC RATING
301st/ 347
METRIC RANK
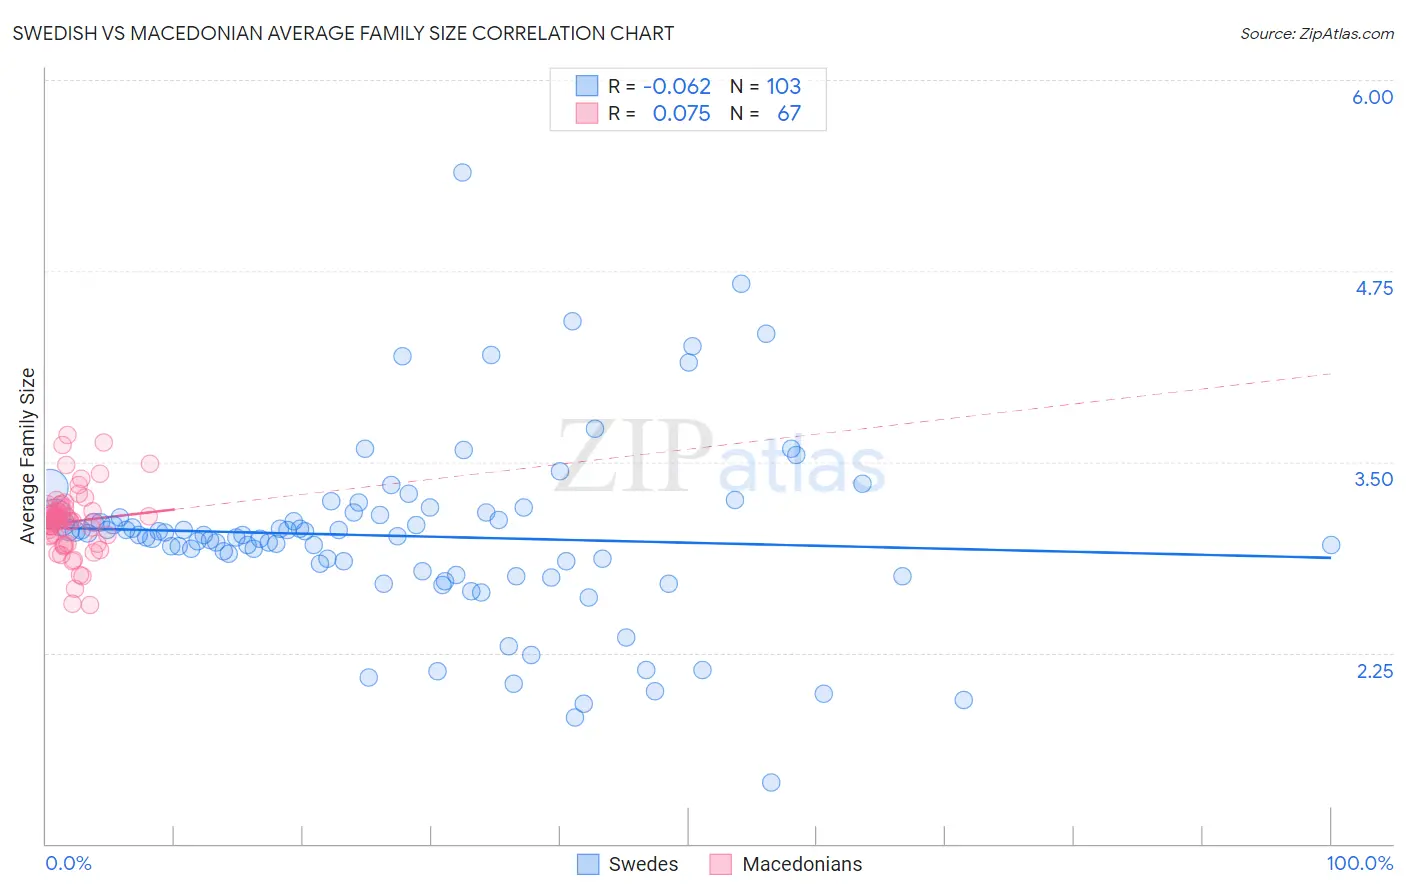
Swedish vs Macedonian Average Family Size Correlation Chart
The statistical analysis conducted on geographies consisting of 538,762,324 people shows a slight negative correlation between the proportion of Swedes and average family size in the United States with a correlation coefficient (R) of -0.062 and weighted average of 3.10. Similarly, the statistical analysis conducted on geographies consisting of 132,621,660 people shows a slight positive correlation between the proportion of Macedonians and average family size in the United States with a correlation coefficient (R) of 0.075 and weighted average of 3.13, a difference of 1.1%.
Average Family Size Correlation Summary
| Measurement | Swedish | Macedonian |
| Minimum | 1.40 | 2.56 |
| Maximum | 5.39 | 3.68 |
| Range | 3.99 | 1.12 |
| Mean | 3.01 | 3.11 |
| Median | 3.02 | 3.12 |
| Interquartile 25% (IQ1) | 2.79 | 3.02 |
| Interquartile 75% (IQ3) | 3.16 | 3.19 |
| Interquartile Range (IQR) | 0.37 | 0.17 |
| Standard Deviation (Sample) | 0.59 | 0.21 |
| Standard Deviation (Population) | 0.59 | 0.21 |
Similar Demographics by Average Family Size
Demographics Similar to Swedes by Average Family Size
In terms of average family size, the demographic groups most similar to Swedes are French (3.10, a difference of 0.020%), Irish (3.10, a difference of 0.030%), Croatian (3.10, a difference of 0.030%), Luxembourger (3.10, a difference of 0.090%), and Lithuanian (3.10, a difference of 0.12%).
| Demographics | Rating | Rank | Average Family Size |
| Latvians | 0.0 /100 | #330 | Tragic 3.11 |
| Scotch-Irish | 0.0 /100 | #331 | Tragic 3.11 |
| Scottish | 0.0 /100 | #332 | Tragic 3.11 |
| Estonians | 0.0 /100 | #333 | Tragic 3.10 |
| Lithuanians | 0.0 /100 | #334 | Tragic 3.10 |
| Luxembourgers | 0.0 /100 | #335 | Tragic 3.10 |
| Irish | 0.0 /100 | #336 | Tragic 3.10 |
| Swedes | 0.0 /100 | #337 | Tragic 3.10 |
| French | 0.0 /100 | #338 | Tragic 3.10 |
| Croatians | 0.0 /100 | #339 | Tragic 3.10 |
| Finns | 0.0 /100 | #340 | Tragic 3.09 |
| Poles | 0.0 /100 | #341 | Tragic 3.09 |
| Germans | 0.0 /100 | #342 | Tragic 3.09 |
| Norwegians | 0.0 /100 | #343 | Tragic 3.08 |
| French Canadians | 0.0 /100 | #344 | Tragic 3.07 |
Demographics Similar to Macedonians by Average Family Size
In terms of average family size, the demographic groups most similar to Macedonians are Immigrants from Latvia (3.13, a difference of 0.0%), British (3.13, a difference of 0.010%), Immigrants from Switzerland (3.13, a difference of 0.030%), Australian (3.13, a difference of 0.060%), and Immigrants from Sweden (3.14, a difference of 0.070%).
| Demographics | Rating | Rank | Average Family Size |
| Immigrants | Croatia | 0.2 /100 | #294 | Tragic 3.14 |
| Austrians | 0.2 /100 | #295 | Tragic 3.14 |
| Ukrainians | 0.2 /100 | #296 | Tragic 3.14 |
| Immigrants | Western Europe | 0.2 /100 | #297 | Tragic 3.14 |
| Colville | 0.2 /100 | #298 | Tragic 3.14 |
| Canadians | 0.2 /100 | #299 | Tragic 3.14 |
| Immigrants | Sweden | 0.2 /100 | #300 | Tragic 3.14 |
| Macedonians | 0.2 /100 | #301 | Tragic 3.13 |
| Immigrants | Latvia | 0.2 /100 | #302 | Tragic 3.13 |
| British | 0.2 /100 | #303 | Tragic 3.13 |
| Immigrants | Switzerland | 0.2 /100 | #304 | Tragic 3.13 |
| Australians | 0.1 /100 | #305 | Tragic 3.13 |
| Immigrants | Ireland | 0.1 /100 | #306 | Tragic 3.13 |
| Immigrants | Serbia | 0.1 /100 | #307 | Tragic 3.13 |
| Slavs | 0.1 /100 | #308 | Tragic 3.13 |