Immigrants from Austria vs Macedonian Average Family Size
COMPARE
Immigrants from Austria
Macedonian
Average Family Size
Average Family Size Comparison
Immigrants from Austria
Macedonians
3.12
AVERAGE FAMILY SIZE
0.0/ 100
METRIC RATING
321st/ 347
METRIC RANK
3.13
AVERAGE FAMILY SIZE
0.2/ 100
METRIC RATING
301st/ 347
METRIC RANK
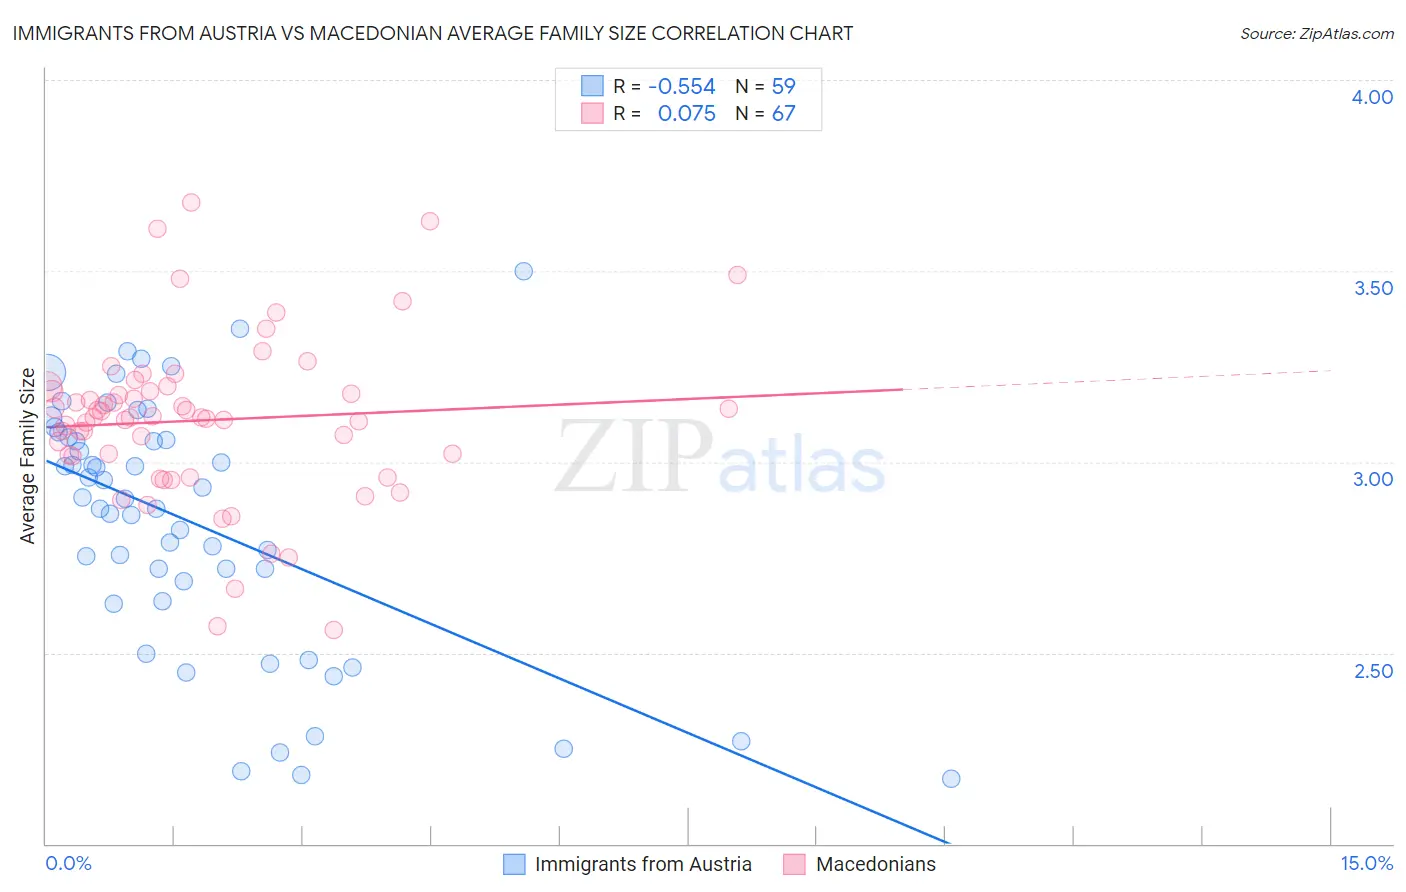
Immigrants from Austria vs Macedonian Average Family Size Correlation Chart
The statistical analysis conducted on geographies consisting of 167,966,875 people shows a substantial negative correlation between the proportion of Immigrants from Austria and average family size in the United States with a correlation coefficient (R) of -0.554 and weighted average of 3.12. Similarly, the statistical analysis conducted on geographies consisting of 132,621,660 people shows a slight positive correlation between the proportion of Macedonians and average family size in the United States with a correlation coefficient (R) of 0.075 and weighted average of 3.13, a difference of 0.60%.
Average Family Size Correlation Summary
| Measurement | Immigrants from Austria | Macedonian |
| Minimum | 2.17 | 2.56 |
| Maximum | 3.50 | 3.68 |
| Range | 1.33 | 1.12 |
| Mean | 2.84 | 3.11 |
| Median | 2.90 | 3.12 |
| Interquartile 25% (IQ1) | 2.64 | 3.02 |
| Interquartile 75% (IQ3) | 3.06 | 3.19 |
| Interquartile Range (IQR) | 0.43 | 0.17 |
| Standard Deviation (Sample) | 0.33 | 0.21 |
| Standard Deviation (Population) | 0.32 | 0.21 |
Demographics Similar to Immigrants from Austria and Macedonians by Average Family Size
In terms of average family size, the demographic groups most similar to Immigrants from Austria are Immigrants from North America (3.12, a difference of 0.030%), Eastern European (3.12, a difference of 0.10%), Welsh (3.12, a difference of 0.10%), Italian (3.12, a difference of 0.11%), and Serbian (3.12, a difference of 0.17%). Similarly, the demographic groups most similar to Macedonians are Immigrants from Latvia (3.13, a difference of 0.0%), British (3.13, a difference of 0.010%), Immigrants from Switzerland (3.13, a difference of 0.030%), Australian (3.13, a difference of 0.060%), and Immigrants from Ireland (3.13, a difference of 0.12%).
| Demographics | Rating | Rank | Average Family Size |
| Macedonians | 0.2 /100 | #301 | Tragic 3.13 |
| Immigrants | Latvia | 0.2 /100 | #302 | Tragic 3.13 |
| British | 0.2 /100 | #303 | Tragic 3.13 |
| Immigrants | Switzerland | 0.2 /100 | #304 | Tragic 3.13 |
| Australians | 0.1 /100 | #305 | Tragic 3.13 |
| Immigrants | Ireland | 0.1 /100 | #306 | Tragic 3.13 |
| Immigrants | Serbia | 0.1 /100 | #307 | Tragic 3.13 |
| Slavs | 0.1 /100 | #308 | Tragic 3.13 |
| Northern Europeans | 0.1 /100 | #309 | Tragic 3.13 |
| Czechoslovakians | 0.1 /100 | #310 | Tragic 3.13 |
| Immigrants | Northern Europe | 0.1 /100 | #311 | Tragic 3.13 |
| Immigrants | Australia | 0.1 /100 | #312 | Tragic 3.13 |
| Bulgarians | 0.1 /100 | #313 | Tragic 3.13 |
| Russians | 0.1 /100 | #314 | Tragic 3.12 |
| Immigrants | Scotland | 0.1 /100 | #315 | Tragic 3.12 |
| Serbians | 0.1 /100 | #316 | Tragic 3.12 |
| Italians | 0.1 /100 | #317 | Tragic 3.12 |
| Eastern Europeans | 0.1 /100 | #318 | Tragic 3.12 |
| Welsh | 0.1 /100 | #319 | Tragic 3.12 |
| Immigrants | North America | 0.0 /100 | #320 | Tragic 3.12 |
| Immigrants | Austria | 0.0 /100 | #321 | Tragic 3.12 |