Taiwanese vs Swedish Single Mother Households
COMPARE
Taiwanese
Swedish
Single Mother Households
Single Mother Households Comparison
Taiwanese
Swedes
5.8%
SINGLE MOTHER HOUSEHOLDS
96.1/ 100
METRIC RATING
105th/ 347
METRIC RANK
5.5%
SINGLE MOTHER HOUSEHOLDS
99.1/ 100
METRIC RATING
52nd/ 347
METRIC RANK
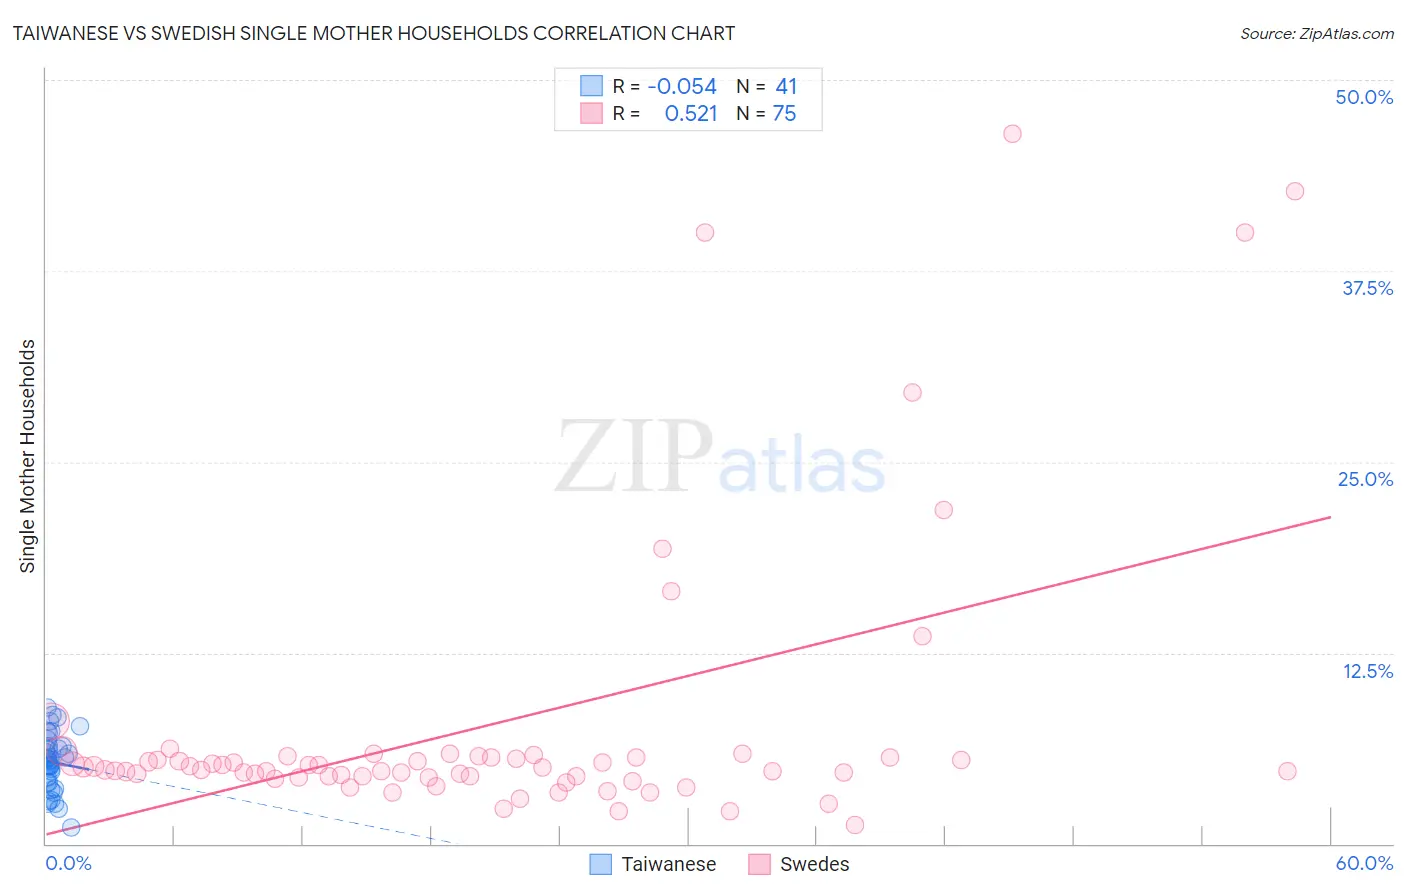
Taiwanese vs Swedish Single Mother Households Correlation Chart
The statistical analysis conducted on geographies consisting of 31,687,013 people shows a slight negative correlation between the proportion of Taiwanese and percentage of single mother households in the United States with a correlation coefficient (R) of -0.054 and weighted average of 5.8%. Similarly, the statistical analysis conducted on geographies consisting of 535,069,304 people shows a substantial positive correlation between the proportion of Swedes and percentage of single mother households in the United States with a correlation coefficient (R) of 0.521 and weighted average of 5.5%, a difference of 4.9%.
Single Mother Households Correlation Summary
| Measurement | Taiwanese | Swedish |
| Minimum | 1.1% | 1.3% |
| Maximum | 8.9% | 46.5% |
| Range | 7.8% | 45.2% |
| Mean | 5.3% | 7.7% |
| Median | 5.5% | 5.0% |
| Interquartile 25% (IQ1) | 4.0% | 4.4% |
| Interquartile 75% (IQ3) | 6.4% | 5.7% |
| Interquartile Range (IQR) | 2.4% | 1.3% |
| Standard Deviation (Sample) | 1.8% | 9.3% |
| Standard Deviation (Population) | 1.8% | 9.3% |
Similar Demographics by Single Mother Households
Demographics Similar to Taiwanese by Single Mother Households
In terms of single mother households, the demographic groups most similar to Taiwanese are Northern European (5.8%, a difference of 0.070%), Scottish (5.8%, a difference of 0.080%), German (5.8%, a difference of 0.10%), English (5.8%, a difference of 0.10%), and Immigrants from Ukraine (5.8%, a difference of 0.10%).
| Demographics | Rating | Rank | Single Mother Households |
| Immigrants | South Africa | 96.3 /100 | #98 | Exceptional 5.7% |
| Immigrants | Poland | 96.3 /100 | #99 | Exceptional 5.8% |
| Scandinavians | 96.2 /100 | #100 | Exceptional 5.8% |
| Germans | 96.2 /100 | #101 | Exceptional 5.8% |
| English | 96.2 /100 | #102 | Exceptional 5.8% |
| Scottish | 96.2 /100 | #103 | Exceptional 5.8% |
| Northern Europeans | 96.2 /100 | #104 | Exceptional 5.8% |
| Taiwanese | 96.1 /100 | #105 | Exceptional 5.8% |
| Immigrants | Ukraine | 95.9 /100 | #106 | Exceptional 5.8% |
| Paraguayans | 95.8 /100 | #107 | Exceptional 5.8% |
| Immigrants | Italy | 95.8 /100 | #108 | Exceptional 5.8% |
| Immigrants | Western Europe | 95.7 /100 | #109 | Exceptional 5.8% |
| British | 95.5 /100 | #110 | Exceptional 5.8% |
| Immigrants | England | 95.5 /100 | #111 | Exceptional 5.8% |
| Immigrants | Kuwait | 95.4 /100 | #112 | Exceptional 5.8% |
Demographics Similar to Swedes by Single Mother Households
In terms of single mother households, the demographic groups most similar to Swedes are Immigrants from Belarus (5.5%, a difference of 0.070%), Immigrants from Scotland (5.5%, a difference of 0.080%), Immigrants from Russia (5.5%, a difference of 0.10%), Immigrants from Lebanon (5.5%, a difference of 0.12%), and Immigrants from Latvia (5.5%, a difference of 0.27%).
| Demographics | Rating | Rank | Single Mother Households |
| Immigrants | Croatia | 99.4 /100 | #45 | Exceptional 5.4% |
| Croatians | 99.3 /100 | #46 | Exceptional 5.5% |
| Norwegians | 99.3 /100 | #47 | Exceptional 5.5% |
| Turks | 99.2 /100 | #48 | Exceptional 5.5% |
| Immigrants | Latvia | 99.2 /100 | #49 | Exceptional 5.5% |
| Immigrants | Scotland | 99.2 /100 | #50 | Exceptional 5.5% |
| Immigrants | Belarus | 99.2 /100 | #51 | Exceptional 5.5% |
| Swedes | 99.1 /100 | #52 | Exceptional 5.5% |
| Immigrants | Russia | 99.1 /100 | #53 | Exceptional 5.5% |
| Immigrants | Lebanon | 99.1 /100 | #54 | Exceptional 5.5% |
| Immigrants | Denmark | 99.1 /100 | #55 | Exceptional 5.5% |
| Immigrants | Romania | 99.0 /100 | #56 | Exceptional 5.5% |
| Immigrants | Europe | 99.0 /100 | #57 | Exceptional 5.5% |
| Danes | 98.9 /100 | #58 | Exceptional 5.5% |
| Luxembourgers | 98.7 /100 | #59 | Exceptional 5.6% |