Russian vs Swedish Single Mother Households
COMPARE
Russian
Swedish
Single Mother Households
Single Mother Households Comparison
Russians
Swedes
5.3%
SINGLE MOTHER HOUSEHOLDS
99.7/ 100
METRIC RATING
28th/ 347
METRIC RANK
5.5%
SINGLE MOTHER HOUSEHOLDS
99.1/ 100
METRIC RATING
52nd/ 347
METRIC RANK
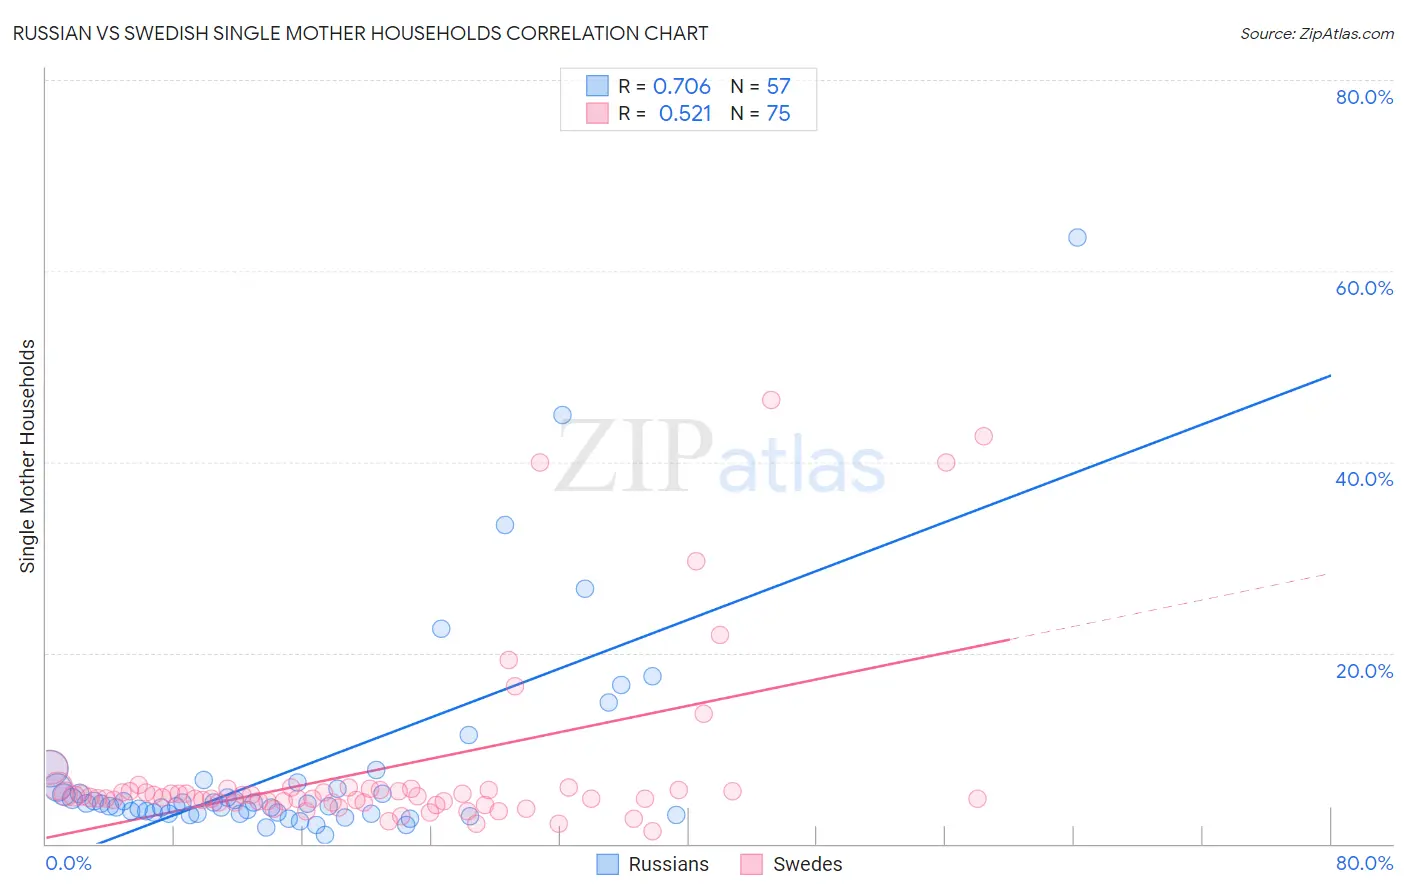
Russian vs Swedish Single Mother Households Correlation Chart
The statistical analysis conducted on geographies consisting of 509,106,631 people shows a strong positive correlation between the proportion of Russians and percentage of single mother households in the United States with a correlation coefficient (R) of 0.706 and weighted average of 5.3%. Similarly, the statistical analysis conducted on geographies consisting of 535,069,304 people shows a substantial positive correlation between the proportion of Swedes and percentage of single mother households in the United States with a correlation coefficient (R) of 0.521 and weighted average of 5.5%, a difference of 4.0%.
Single Mother Households Correlation Summary
| Measurement | Russian | Swedish |
| Minimum | 0.89% | 1.3% |
| Maximum | 63.5% | 46.5% |
| Range | 62.6% | 45.2% |
| Mean | 7.8% | 7.7% |
| Median | 4.2% | 5.0% |
| Interquartile 25% (IQ1) | 3.2% | 4.4% |
| Interquartile 75% (IQ3) | 5.8% | 5.7% |
| Interquartile Range (IQR) | 2.6% | 1.3% |
| Standard Deviation (Sample) | 11.0% | 9.3% |
| Standard Deviation (Population) | 10.9% | 9.3% |
Similar Demographics by Single Mother Households
Demographics Similar to Russians by Single Mother Households
In terms of single mother households, the demographic groups most similar to Russians are Latvian (5.3%, a difference of 0.010%), Burmese (5.3%, a difference of 0.080%), Immigrants from Korea (5.3%, a difference of 0.080%), Cambodian (5.3%, a difference of 0.090%), and Bhutanese (5.3%, a difference of 0.10%).
| Demographics | Rating | Rank | Single Mother Households |
| Eastern Europeans | 99.8 /100 | #21 | Exceptional 5.2% |
| Thais | 99.8 /100 | #22 | Exceptional 5.2% |
| Immigrants | Austria | 99.8 /100 | #23 | Exceptional 5.2% |
| Armenians | 99.8 /100 | #24 | Exceptional 5.2% |
| Immigrants | Japan | 99.8 /100 | #25 | Exceptional 5.2% |
| Immigrants | Lithuania | 99.8 /100 | #26 | Exceptional 5.3% |
| Bhutanese | 99.7 /100 | #27 | Exceptional 5.3% |
| Russians | 99.7 /100 | #28 | Exceptional 5.3% |
| Latvians | 99.7 /100 | #29 | Exceptional 5.3% |
| Burmese | 99.7 /100 | #30 | Exceptional 5.3% |
| Immigrants | Korea | 99.7 /100 | #31 | Exceptional 5.3% |
| Cambodians | 99.7 /100 | #32 | Exceptional 5.3% |
| Immigrants | Switzerland | 99.7 /100 | #33 | Exceptional 5.3% |
| Bulgarians | 99.7 /100 | #34 | Exceptional 5.3% |
| Immigrants | Northern Europe | 99.7 /100 | #35 | Exceptional 5.3% |
Demographics Similar to Swedes by Single Mother Households
In terms of single mother households, the demographic groups most similar to Swedes are Immigrants from Belarus (5.5%, a difference of 0.070%), Immigrants from Scotland (5.5%, a difference of 0.080%), Immigrants from Russia (5.5%, a difference of 0.10%), Immigrants from Lebanon (5.5%, a difference of 0.12%), and Immigrants from Latvia (5.5%, a difference of 0.27%).
| Demographics | Rating | Rank | Single Mother Households |
| Immigrants | Croatia | 99.4 /100 | #45 | Exceptional 5.4% |
| Croatians | 99.3 /100 | #46 | Exceptional 5.5% |
| Norwegians | 99.3 /100 | #47 | Exceptional 5.5% |
| Turks | 99.2 /100 | #48 | Exceptional 5.5% |
| Immigrants | Latvia | 99.2 /100 | #49 | Exceptional 5.5% |
| Immigrants | Scotland | 99.2 /100 | #50 | Exceptional 5.5% |
| Immigrants | Belarus | 99.2 /100 | #51 | Exceptional 5.5% |
| Swedes | 99.1 /100 | #52 | Exceptional 5.5% |
| Immigrants | Russia | 99.1 /100 | #53 | Exceptional 5.5% |
| Immigrants | Lebanon | 99.1 /100 | #54 | Exceptional 5.5% |
| Immigrants | Denmark | 99.1 /100 | #55 | Exceptional 5.5% |
| Immigrants | Romania | 99.0 /100 | #56 | Exceptional 5.5% |
| Immigrants | Europe | 99.0 /100 | #57 | Exceptional 5.5% |
| Danes | 98.9 /100 | #58 | Exceptional 5.5% |
| Luxembourgers | 98.7 /100 | #59 | Exceptional 5.6% |