Black/African American vs Swedish Single Mother Households
COMPARE
Black/African American
Swedish
Single Mother Households
Single Mother Households Comparison
Blacks/African Americans
Swedes
9.0%
SINGLE MOTHER HOUSEHOLDS
0.0/ 100
METRIC RATING
339th/ 347
METRIC RANK
5.5%
SINGLE MOTHER HOUSEHOLDS
99.1/ 100
METRIC RATING
52nd/ 347
METRIC RANK
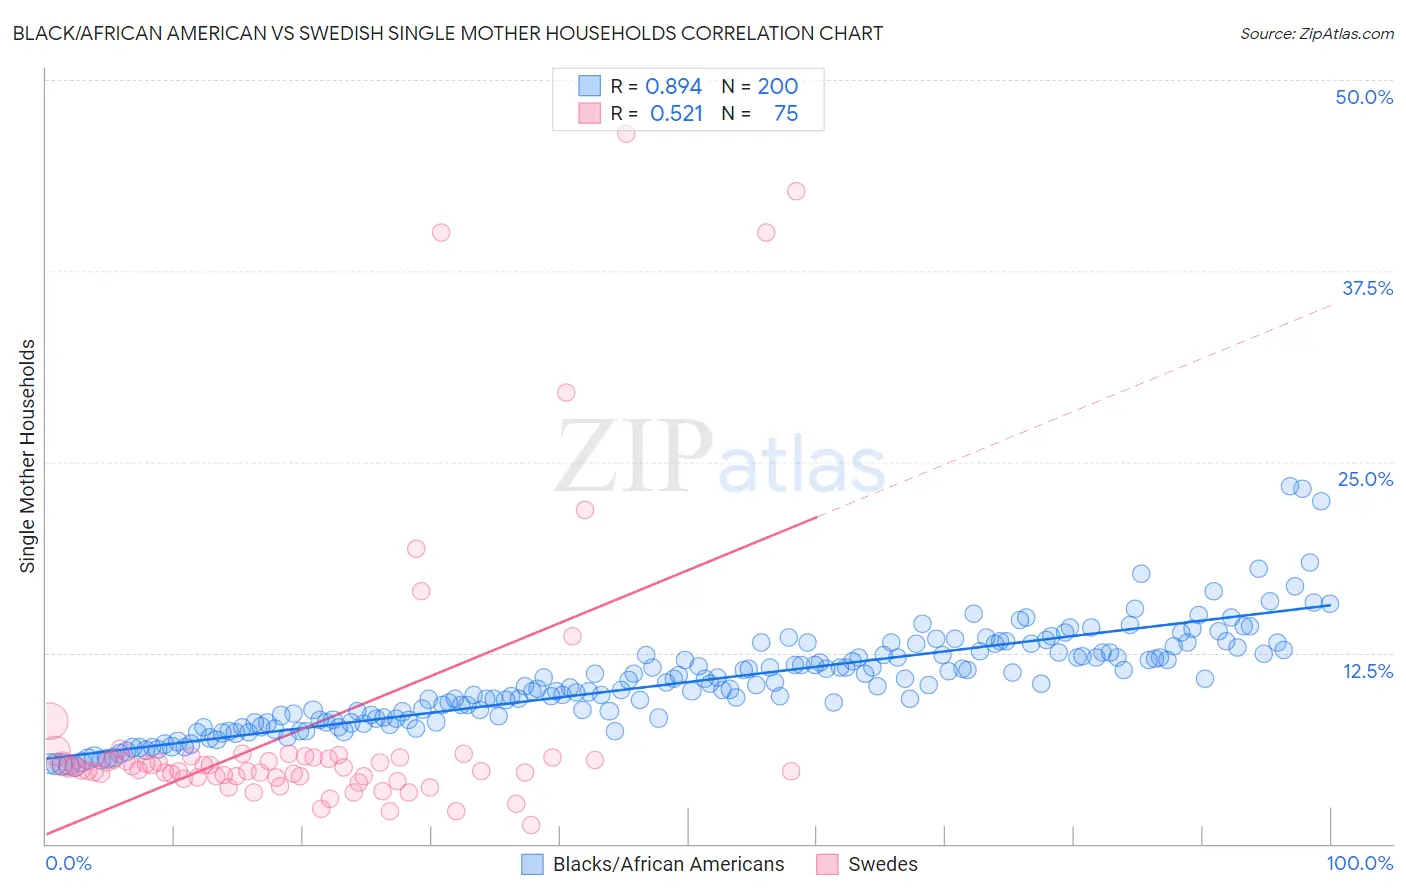
Black/African American vs Swedish Single Mother Households Correlation Chart
The statistical analysis conducted on geographies consisting of 561,713,889 people shows a very strong positive correlation between the proportion of Blacks/African Americans and percentage of single mother households in the United States with a correlation coefficient (R) of 0.894 and weighted average of 9.0%. Similarly, the statistical analysis conducted on geographies consisting of 535,069,304 people shows a substantial positive correlation between the proportion of Swedes and percentage of single mother households in the United States with a correlation coefficient (R) of 0.521 and weighted average of 5.5%, a difference of 63.6%.
Single Mother Households Correlation Summary
| Measurement | Black/African American | Swedish |
| Minimum | 5.1% | 1.3% |
| Maximum | 23.4% | 46.5% |
| Range | 18.3% | 45.2% |
| Mean | 10.6% | 7.7% |
| Median | 10.4% | 5.0% |
| Interquartile 25% (IQ1) | 8.1% | 4.4% |
| Interquartile 75% (IQ3) | 12.5% | 5.7% |
| Interquartile Range (IQR) | 4.4% | 1.3% |
| Standard Deviation (Sample) | 3.3% | 9.3% |
| Standard Deviation (Population) | 3.2% | 9.3% |
Similar Demographics by Single Mother Households
Demographics Similar to Blacks/African Americans by Single Mother Households
In terms of single mother households, the demographic groups most similar to Blacks/African Americans are Lumbee (9.1%, a difference of 1.2%), Cape Verdean (8.9%, a difference of 1.5%), Tohono O'odham (9.1%, a difference of 1.6%), Navajo (8.8%, a difference of 1.7%), and Menominee (9.2%, a difference of 1.9%).
| Demographics | Rating | Rank | Single Mother Households |
| U.S. Virgin Islanders | 0.0 /100 | #332 | Tragic 8.6% |
| Liberians | 0.0 /100 | #333 | Tragic 8.6% |
| Immigrants | Liberia | 0.0 /100 | #334 | Tragic 8.7% |
| Immigrants | Dominica | 0.0 /100 | #335 | Tragic 8.7% |
| Puerto Ricans | 0.0 /100 | #336 | Tragic 8.7% |
| Navajo | 0.0 /100 | #337 | Tragic 8.8% |
| Cape Verdeans | 0.0 /100 | #338 | Tragic 8.9% |
| Blacks/African Americans | 0.0 /100 | #339 | Tragic 9.0% |
| Lumbee | 0.0 /100 | #340 | Tragic 9.1% |
| Tohono O'odham | 0.0 /100 | #341 | Tragic 9.1% |
| Menominee | 0.0 /100 | #342 | Tragic 9.2% |
| Dominicans | 0.0 /100 | #343 | Tragic 9.2% |
| Immigrants | Dominican Republic | 0.0 /100 | #344 | Tragic 9.5% |
| Immigrants | Cabo Verde | 0.0 /100 | #345 | Tragic 9.6% |
| Yuman | 0.0 /100 | #346 | Tragic 9.6% |
Demographics Similar to Swedes by Single Mother Households
In terms of single mother households, the demographic groups most similar to Swedes are Immigrants from Belarus (5.5%, a difference of 0.070%), Immigrants from Scotland (5.5%, a difference of 0.080%), Immigrants from Russia (5.5%, a difference of 0.10%), Immigrants from Lebanon (5.5%, a difference of 0.12%), and Immigrants from Latvia (5.5%, a difference of 0.27%).
| Demographics | Rating | Rank | Single Mother Households |
| Immigrants | Croatia | 99.4 /100 | #45 | Exceptional 5.4% |
| Croatians | 99.3 /100 | #46 | Exceptional 5.5% |
| Norwegians | 99.3 /100 | #47 | Exceptional 5.5% |
| Turks | 99.2 /100 | #48 | Exceptional 5.5% |
| Immigrants | Latvia | 99.2 /100 | #49 | Exceptional 5.5% |
| Immigrants | Scotland | 99.2 /100 | #50 | Exceptional 5.5% |
| Immigrants | Belarus | 99.2 /100 | #51 | Exceptional 5.5% |
| Swedes | 99.1 /100 | #52 | Exceptional 5.5% |
| Immigrants | Russia | 99.1 /100 | #53 | Exceptional 5.5% |
| Immigrants | Lebanon | 99.1 /100 | #54 | Exceptional 5.5% |
| Immigrants | Denmark | 99.1 /100 | #55 | Exceptional 5.5% |
| Immigrants | Romania | 99.0 /100 | #56 | Exceptional 5.5% |
| Immigrants | Europe | 99.0 /100 | #57 | Exceptional 5.5% |
| Danes | 98.9 /100 | #58 | Exceptional 5.5% |
| Luxembourgers | 98.7 /100 | #59 | Exceptional 5.6% |