Tongan vs Swedish Single Mother Households
COMPARE
Tongan
Swedish
Single Mother Households
Single Mother Households Comparison
Tongans
Swedes
5.8%
SINGLE MOTHER HOUSEHOLDS
93.7/ 100
METRIC RATING
120th/ 347
METRIC RANK
5.5%
SINGLE MOTHER HOUSEHOLDS
99.1/ 100
METRIC RATING
52nd/ 347
METRIC RANK
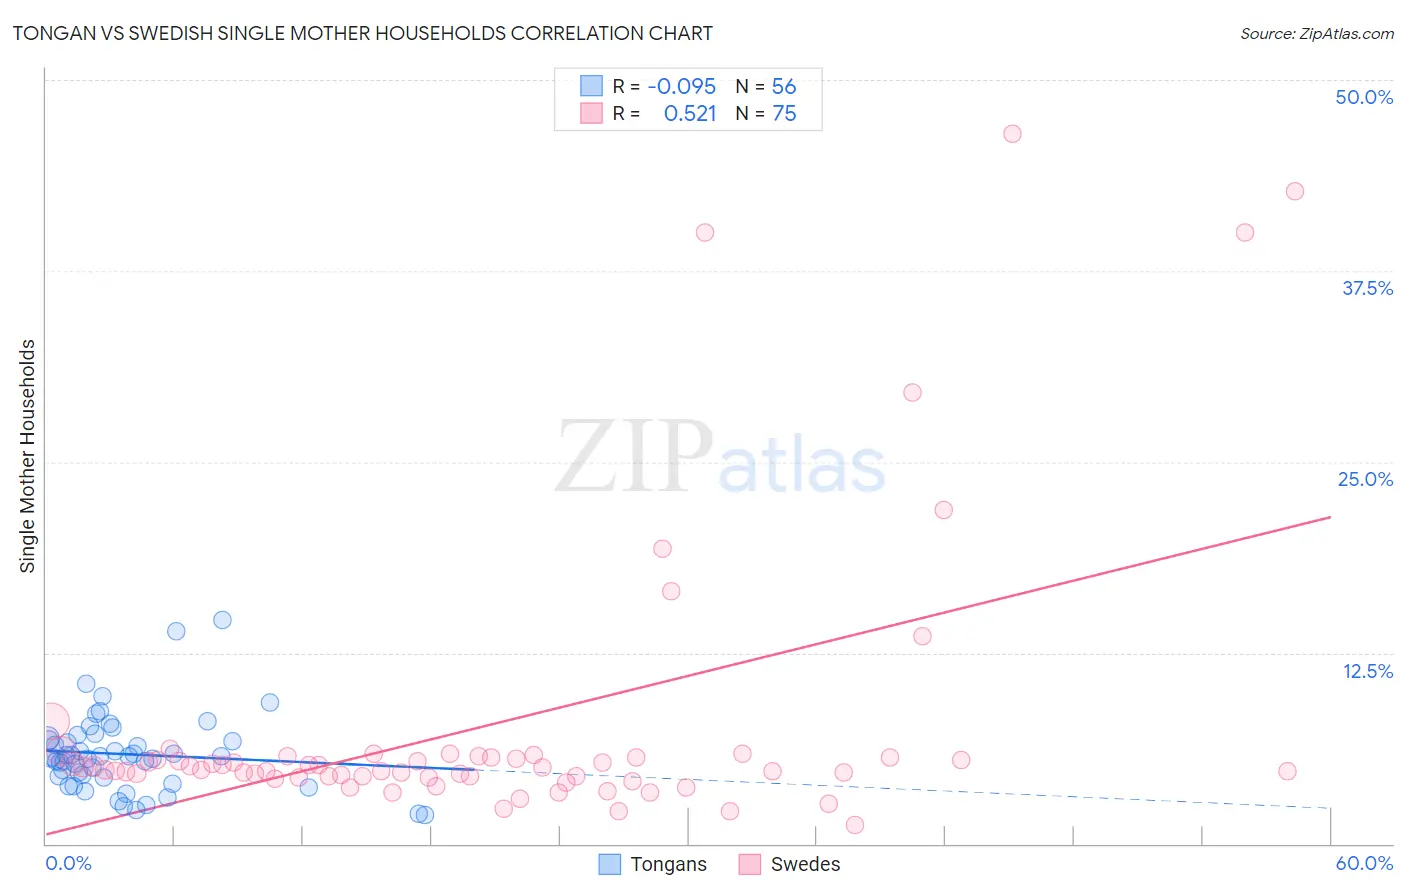
Tongan vs Swedish Single Mother Households Correlation Chart
The statistical analysis conducted on geographies consisting of 102,827,283 people shows a slight negative correlation between the proportion of Tongans and percentage of single mother households in the United States with a correlation coefficient (R) of -0.095 and weighted average of 5.8%. Similarly, the statistical analysis conducted on geographies consisting of 535,069,304 people shows a substantial positive correlation between the proportion of Swedes and percentage of single mother households in the United States with a correlation coefficient (R) of 0.521 and weighted average of 5.5%, a difference of 6.4%.
Single Mother Households Correlation Summary
| Measurement | Tongan | Swedish |
| Minimum | 1.9% | 1.3% |
| Maximum | 14.7% | 46.5% |
| Range | 12.8% | 45.2% |
| Mean | 5.9% | 7.7% |
| Median | 5.7% | 5.0% |
| Interquartile 25% (IQ1) | 4.4% | 4.4% |
| Interquartile 75% (IQ3) | 6.8% | 5.7% |
| Interquartile Range (IQR) | 2.5% | 1.3% |
| Standard Deviation (Sample) | 2.5% | 9.3% |
| Standard Deviation (Population) | 2.5% | 9.3% |
Similar Demographics by Single Mother Households
Demographics Similar to Tongans by Single Mother Households
In terms of single mother households, the demographic groups most similar to Tongans are Argentinean (5.8%, a difference of 0.020%), Belgian (5.8%, a difference of 0.10%), Immigrants from Uzbekistan (5.9%, a difference of 0.17%), South African (5.8%, a difference of 0.19%), and Immigrants from Argentina (5.9%, a difference of 0.23%).
| Demographics | Rating | Rank | Single Mother Households |
| Mongolians | 95.3 /100 | #113 | Exceptional 5.8% |
| Dutch | 95.1 /100 | #114 | Exceptional 5.8% |
| Irish | 94.8 /100 | #115 | Exceptional 5.8% |
| Pennsylvania Germans | 94.7 /100 | #116 | Exceptional 5.8% |
| Bolivians | 94.6 /100 | #117 | Exceptional 5.8% |
| Laotians | 94.3 /100 | #118 | Exceptional 5.8% |
| South Africans | 94.1 /100 | #119 | Exceptional 5.8% |
| Tongans | 93.7 /100 | #120 | Exceptional 5.8% |
| Argentineans | 93.7 /100 | #121 | Exceptional 5.8% |
| Belgians | 93.5 /100 | #122 | Exceptional 5.8% |
| Immigrants | Uzbekistan | 93.4 /100 | #123 | Exceptional 5.9% |
| Immigrants | Argentina | 93.2 /100 | #124 | Exceptional 5.9% |
| Slavs | 92.9 /100 | #125 | Exceptional 5.9% |
| Welsh | 92.8 /100 | #126 | Exceptional 5.9% |
| Lebanese | 92.4 /100 | #127 | Exceptional 5.9% |
Demographics Similar to Swedes by Single Mother Households
In terms of single mother households, the demographic groups most similar to Swedes are Immigrants from Belarus (5.5%, a difference of 0.070%), Immigrants from Scotland (5.5%, a difference of 0.080%), Immigrants from Russia (5.5%, a difference of 0.10%), Immigrants from Lebanon (5.5%, a difference of 0.12%), and Immigrants from Latvia (5.5%, a difference of 0.27%).
| Demographics | Rating | Rank | Single Mother Households |
| Immigrants | Croatia | 99.4 /100 | #45 | Exceptional 5.4% |
| Croatians | 99.3 /100 | #46 | Exceptional 5.5% |
| Norwegians | 99.3 /100 | #47 | Exceptional 5.5% |
| Turks | 99.2 /100 | #48 | Exceptional 5.5% |
| Immigrants | Latvia | 99.2 /100 | #49 | Exceptional 5.5% |
| Immigrants | Scotland | 99.2 /100 | #50 | Exceptional 5.5% |
| Immigrants | Belarus | 99.2 /100 | #51 | Exceptional 5.5% |
| Swedes | 99.1 /100 | #52 | Exceptional 5.5% |
| Immigrants | Russia | 99.1 /100 | #53 | Exceptional 5.5% |
| Immigrants | Lebanon | 99.1 /100 | #54 | Exceptional 5.5% |
| Immigrants | Denmark | 99.1 /100 | #55 | Exceptional 5.5% |
| Immigrants | Romania | 99.0 /100 | #56 | Exceptional 5.5% |
| Immigrants | Europe | 99.0 /100 | #57 | Exceptional 5.5% |
| Danes | 98.9 /100 | #58 | Exceptional 5.5% |
| Luxembourgers | 98.7 /100 | #59 | Exceptional 5.6% |