Alaska Native vs Swedish Single Mother Households
COMPARE
Alaska Native
Swedish
Single Mother Households
Single Mother Households Comparison
Alaska Natives
Swedes
7.4%
SINGLE MOTHER HOUSEHOLDS
0.2/ 100
METRIC RATING
257th/ 347
METRIC RANK
5.5%
SINGLE MOTHER HOUSEHOLDS
99.1/ 100
METRIC RATING
52nd/ 347
METRIC RANK
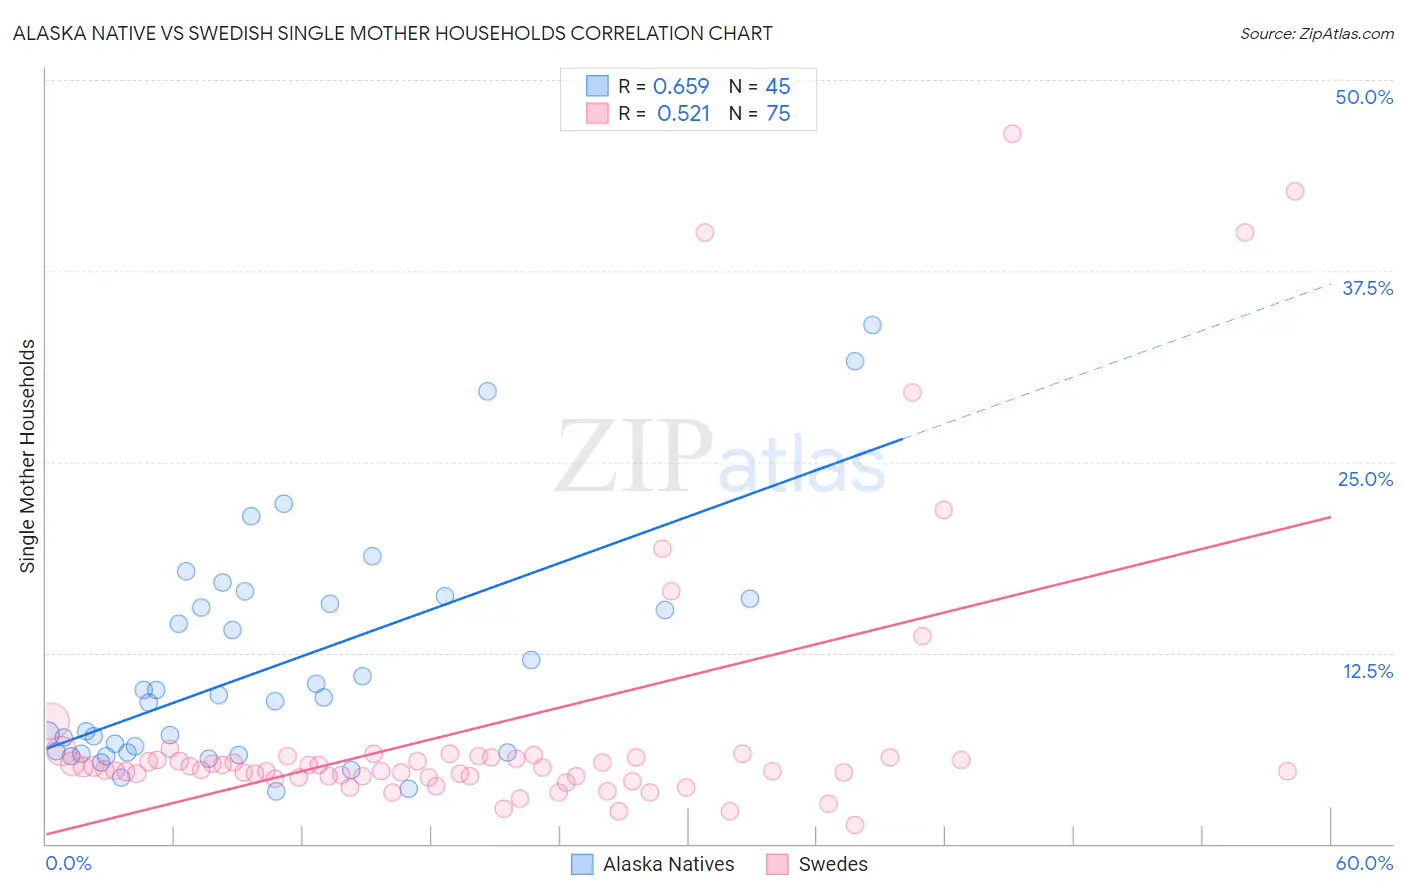
Alaska Native vs Swedish Single Mother Households Correlation Chart
The statistical analysis conducted on geographies consisting of 76,685,666 people shows a significant positive correlation between the proportion of Alaska Natives and percentage of single mother households in the United States with a correlation coefficient (R) of 0.659 and weighted average of 7.4%. Similarly, the statistical analysis conducted on geographies consisting of 535,069,304 people shows a substantial positive correlation between the proportion of Swedes and percentage of single mother households in the United States with a correlation coefficient (R) of 0.521 and weighted average of 5.5%, a difference of 34.7%.
Single Mother Households Correlation Summary
| Measurement | Alaska Native | Swedish |
| Minimum | 3.4% | 1.3% |
| Maximum | 34.0% | 46.5% |
| Range | 30.6% | 45.2% |
| Mean | 11.7% | 7.7% |
| Median | 9.6% | 5.0% |
| Interquartile 25% (IQ1) | 6.0% | 4.4% |
| Interquartile 75% (IQ3) | 15.9% | 5.7% |
| Interquartile Range (IQR) | 9.9% | 1.3% |
| Standard Deviation (Sample) | 7.4% | 9.3% |
| Standard Deviation (Population) | 7.3% | 9.3% |
Similar Demographics by Single Mother Households
Demographics Similar to Alaska Natives by Single Mother Households
In terms of single mother households, the demographic groups most similar to Alaska Natives are Pueblo (7.4%, a difference of 0.020%), Seminole (7.4%, a difference of 0.040%), Immigrants from Yemen (7.4%, a difference of 0.040%), Immigrants from Zaire (7.4%, a difference of 0.080%), and Japanese (7.4%, a difference of 0.10%).
| Demographics | Rating | Rank | Single Mother Households |
| Immigrants | Africa | 0.4 /100 | #250 | Tragic 7.3% |
| Malaysians | 0.3 /100 | #251 | Tragic 7.3% |
| Alaskan Athabascans | 0.3 /100 | #252 | Tragic 7.3% |
| Cajuns | 0.3 /100 | #253 | Tragic 7.3% |
| Immigrants | Ecuador | 0.3 /100 | #254 | Tragic 7.3% |
| Mexican American Indians | 0.2 /100 | #255 | Tragic 7.4% |
| Seminole | 0.2 /100 | #256 | Tragic 7.4% |
| Alaska Natives | 0.2 /100 | #257 | Tragic 7.4% |
| Pueblo | 0.2 /100 | #258 | Tragic 7.4% |
| Immigrants | Yemen | 0.2 /100 | #259 | Tragic 7.4% |
| Immigrants | Zaire | 0.2 /100 | #260 | Tragic 7.4% |
| Japanese | 0.2 /100 | #261 | Tragic 7.4% |
| Immigrants | Somalia | 0.2 /100 | #262 | Tragic 7.4% |
| Immigrants | Nicaragua | 0.2 /100 | #263 | Tragic 7.4% |
| Yaqui | 0.1 /100 | #264 | Tragic 7.4% |
Demographics Similar to Swedes by Single Mother Households
In terms of single mother households, the demographic groups most similar to Swedes are Immigrants from Belarus (5.5%, a difference of 0.070%), Immigrants from Scotland (5.5%, a difference of 0.080%), Immigrants from Russia (5.5%, a difference of 0.10%), Immigrants from Lebanon (5.5%, a difference of 0.12%), and Immigrants from Latvia (5.5%, a difference of 0.27%).
| Demographics | Rating | Rank | Single Mother Households |
| Immigrants | Croatia | 99.4 /100 | #45 | Exceptional 5.4% |
| Croatians | 99.3 /100 | #46 | Exceptional 5.5% |
| Norwegians | 99.3 /100 | #47 | Exceptional 5.5% |
| Turks | 99.2 /100 | #48 | Exceptional 5.5% |
| Immigrants | Latvia | 99.2 /100 | #49 | Exceptional 5.5% |
| Immigrants | Scotland | 99.2 /100 | #50 | Exceptional 5.5% |
| Immigrants | Belarus | 99.2 /100 | #51 | Exceptional 5.5% |
| Swedes | 99.1 /100 | #52 | Exceptional 5.5% |
| Immigrants | Russia | 99.1 /100 | #53 | Exceptional 5.5% |
| Immigrants | Lebanon | 99.1 /100 | #54 | Exceptional 5.5% |
| Immigrants | Denmark | 99.1 /100 | #55 | Exceptional 5.5% |
| Immigrants | Romania | 99.0 /100 | #56 | Exceptional 5.5% |
| Immigrants | Europe | 99.0 /100 | #57 | Exceptional 5.5% |
| Danes | 98.9 /100 | #58 | Exceptional 5.5% |
| Luxembourgers | 98.7 /100 | #59 | Exceptional 5.6% |