Blackfeet vs Immigrants from Lithuania Single Mother Households
COMPARE
Blackfeet
Immigrants from Lithuania
Single Mother Households
Single Mother Households Comparison
Blackfeet
Immigrants from Lithuania
7.5%
SINGLE MOTHER HOUSEHOLDS
0.1/ 100
METRIC RATING
267th/ 347
METRIC RANK
5.3%
SINGLE MOTHER HOUSEHOLDS
99.8/ 100
METRIC RATING
26th/ 347
METRIC RANK
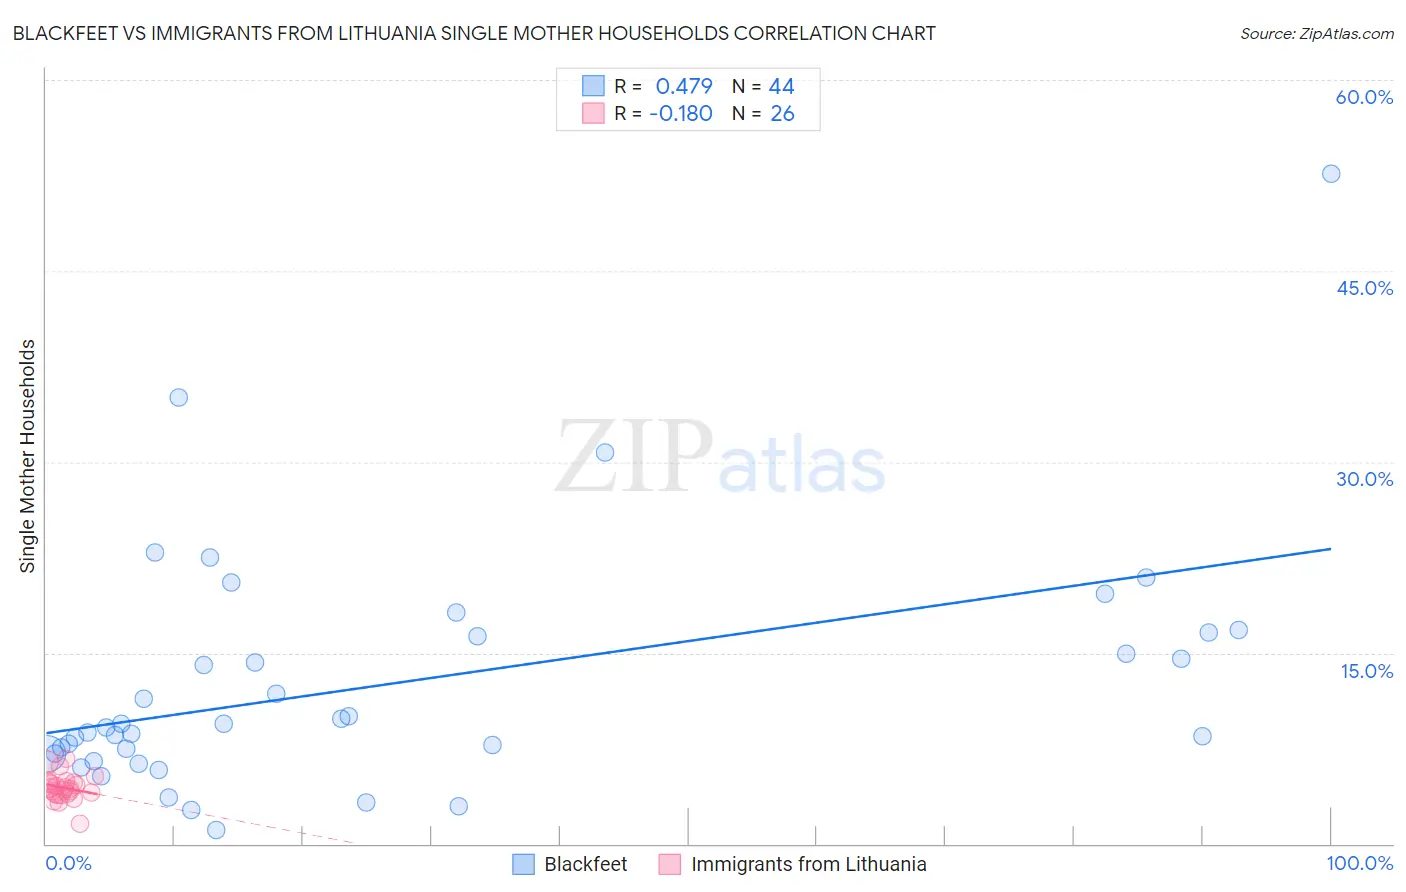
Blackfeet vs Immigrants from Lithuania Single Mother Households Correlation Chart
The statistical analysis conducted on geographies consisting of 309,066,694 people shows a moderate positive correlation between the proportion of Blackfeet and percentage of single mother households in the United States with a correlation coefficient (R) of 0.479 and weighted average of 7.5%. Similarly, the statistical analysis conducted on geographies consisting of 117,657,172 people shows a poor negative correlation between the proportion of Immigrants from Lithuania and percentage of single mother households in the United States with a correlation coefficient (R) of -0.180 and weighted average of 5.3%, a difference of 42.5%.
Single Mother Households Correlation Summary
| Measurement | Blackfeet | Immigrants from Lithuania |
| Minimum | 1.1% | 1.5% |
| Maximum | 52.6% | 6.7% |
| Range | 51.5% | 5.2% |
| Mean | 12.5% | 4.4% |
| Median | 9.2% | 4.3% |
| Interquartile 25% (IQ1) | 7.1% | 3.9% |
| Interquartile 75% (IQ3) | 16.4% | 4.8% |
| Interquartile Range (IQR) | 9.3% | 0.89% |
| Standard Deviation (Sample) | 9.5% | 1.0% |
| Standard Deviation (Population) | 9.4% | 1.0% |
Similar Demographics by Single Mother Households
Demographics Similar to Blackfeet by Single Mother Households
In terms of single mother households, the demographic groups most similar to Blackfeet are Indonesian (7.5%, a difference of 0.040%), Nepalese (7.5%, a difference of 0.34%), Crow (7.4%, a difference of 0.43%), Somali (7.5%, a difference of 0.45%), and Yaqui (7.4%, a difference of 0.61%).
| Demographics | Rating | Rank | Single Mother Households |
| Immigrants | Zaire | 0.2 /100 | #260 | Tragic 7.4% |
| Japanese | 0.2 /100 | #261 | Tragic 7.4% |
| Immigrants | Somalia | 0.2 /100 | #262 | Tragic 7.4% |
| Immigrants | Nicaragua | 0.2 /100 | #263 | Tragic 7.4% |
| Yaqui | 0.1 /100 | #264 | Tragic 7.4% |
| Crow | 0.1 /100 | #265 | Tragic 7.4% |
| Nepalese | 0.1 /100 | #266 | Tragic 7.5% |
| Blackfeet | 0.1 /100 | #267 | Tragic 7.5% |
| Indonesians | 0.1 /100 | #268 | Tragic 7.5% |
| Somalis | 0.1 /100 | #269 | Tragic 7.5% |
| Immigrants | Cuba | 0.1 /100 | #270 | Tragic 7.5% |
| Salvadorans | 0.1 /100 | #271 | Tragic 7.5% |
| Immigrants | Azores | 0.1 /100 | #272 | Tragic 7.5% |
| Belizeans | 0.1 /100 | #273 | Tragic 7.6% |
| Immigrants | Guyana | 0.1 /100 | #274 | Tragic 7.6% |
Demographics Similar to Immigrants from Lithuania by Single Mother Households
In terms of single mother households, the demographic groups most similar to Immigrants from Lithuania are Immigrants from Japan (5.2%, a difference of 0.030%), Armenian (5.2%, a difference of 0.36%), Immigrants from Austria (5.2%, a difference of 0.42%), Thai (5.2%, a difference of 0.47%), and Bhutanese (5.3%, a difference of 0.51%).
| Demographics | Rating | Rank | Single Mother Households |
| Chinese | 99.9 /100 | #19 | Exceptional 5.2% |
| Maltese | 99.9 /100 | #20 | Exceptional 5.2% |
| Eastern Europeans | 99.8 /100 | #21 | Exceptional 5.2% |
| Thais | 99.8 /100 | #22 | Exceptional 5.2% |
| Immigrants | Austria | 99.8 /100 | #23 | Exceptional 5.2% |
| Armenians | 99.8 /100 | #24 | Exceptional 5.2% |
| Immigrants | Japan | 99.8 /100 | #25 | Exceptional 5.2% |
| Immigrants | Lithuania | 99.8 /100 | #26 | Exceptional 5.3% |
| Bhutanese | 99.7 /100 | #27 | Exceptional 5.3% |
| Russians | 99.7 /100 | #28 | Exceptional 5.3% |
| Latvians | 99.7 /100 | #29 | Exceptional 5.3% |
| Burmese | 99.7 /100 | #30 | Exceptional 5.3% |
| Immigrants | Korea | 99.7 /100 | #31 | Exceptional 5.3% |
| Cambodians | 99.7 /100 | #32 | Exceptional 5.3% |
| Immigrants | Switzerland | 99.7 /100 | #33 | Exceptional 5.3% |