Ecuadorian vs Immigrants from Lithuania Single Mother Households
COMPARE
Ecuadorian
Immigrants from Lithuania
Single Mother Households
Single Mother Households Comparison
Ecuadorians
Immigrants from Lithuania
7.2%
SINGLE MOTHER HOUSEHOLDS
0.6/ 100
METRIC RATING
243rd/ 347
METRIC RANK
5.3%
SINGLE MOTHER HOUSEHOLDS
99.8/ 100
METRIC RATING
26th/ 347
METRIC RANK
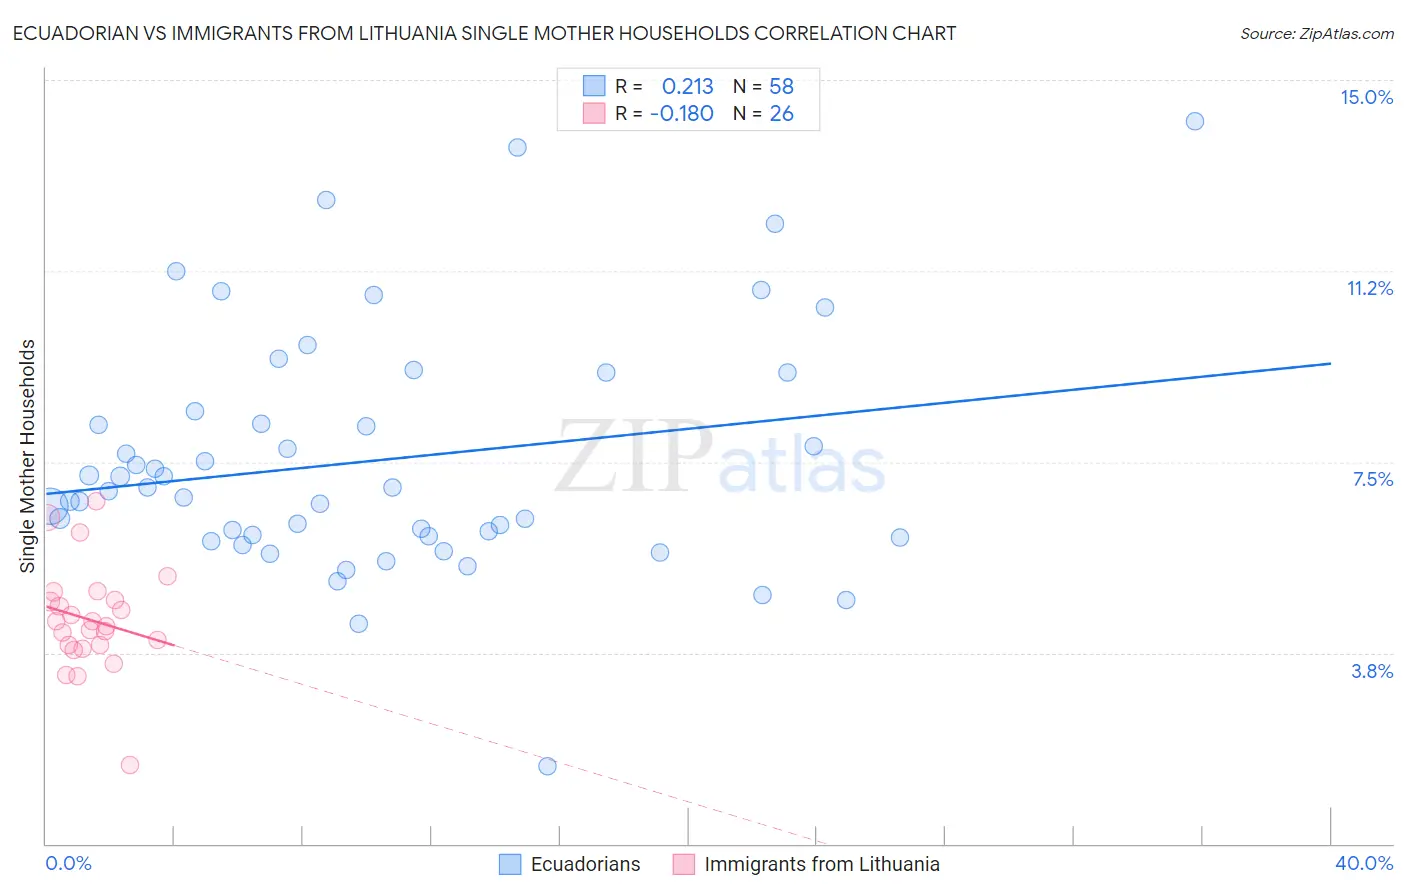
Ecuadorian vs Immigrants from Lithuania Single Mother Households Correlation Chart
The statistical analysis conducted on geographies consisting of 317,272,224 people shows a weak positive correlation between the proportion of Ecuadorians and percentage of single mother households in the United States with a correlation coefficient (R) of 0.213 and weighted average of 7.2%. Similarly, the statistical analysis conducted on geographies consisting of 117,657,172 people shows a poor negative correlation between the proportion of Immigrants from Lithuania and percentage of single mother households in the United States with a correlation coefficient (R) of -0.180 and weighted average of 5.3%, a difference of 37.0%.
Single Mother Households Correlation Summary
| Measurement | Ecuadorian | Immigrants from Lithuania |
| Minimum | 1.5% | 1.5% |
| Maximum | 14.2% | 6.7% |
| Range | 12.7% | 5.2% |
| Mean | 7.5% | 4.4% |
| Median | 7.0% | 4.3% |
| Interquartile 25% (IQ1) | 6.0% | 3.9% |
| Interquartile 75% (IQ3) | 8.5% | 4.8% |
| Interquartile Range (IQR) | 2.5% | 0.89% |
| Standard Deviation (Sample) | 2.4% | 1.0% |
| Standard Deviation (Population) | 2.4% | 1.0% |
Similar Demographics by Single Mother Households
Demographics Similar to Ecuadorians by Single Mother Households
In terms of single mother households, the demographic groups most similar to Ecuadorians are Fijian (7.2%, a difference of 0.050%), Cuban (7.2%, a difference of 0.070%), Immigrants from Portugal (7.2%, a difference of 0.13%), Immigrants from Cambodia (7.2%, a difference of 0.41%), and Immigrants from Panama (7.2%, a difference of 0.48%).
| Demographics | Rating | Rank | Single Mother Households |
| Ute | 1.0 /100 | #236 | Tragic 7.1% |
| Arapaho | 1.0 /100 | #237 | Tragic 7.1% |
| Panamanians | 0.9 /100 | #238 | Tragic 7.1% |
| Kiowa | 0.8 /100 | #239 | Tragic 7.1% |
| Immigrants | Panama | 0.7 /100 | #240 | Tragic 7.2% |
| Immigrants | Portugal | 0.6 /100 | #241 | Tragic 7.2% |
| Fijians | 0.6 /100 | #242 | Tragic 7.2% |
| Ecuadorians | 0.6 /100 | #243 | Tragic 7.2% |
| Cubans | 0.6 /100 | #244 | Tragic 7.2% |
| Immigrants | Cambodia | 0.5 /100 | #245 | Tragic 7.2% |
| Nicaraguans | 0.5 /100 | #246 | Tragic 7.2% |
| Dutch West Indians | 0.4 /100 | #247 | Tragic 7.3% |
| Spanish American Indians | 0.4 /100 | #248 | Tragic 7.3% |
| Bermudans | 0.4 /100 | #249 | Tragic 7.3% |
| Immigrants | Africa | 0.4 /100 | #250 | Tragic 7.3% |
Demographics Similar to Immigrants from Lithuania by Single Mother Households
In terms of single mother households, the demographic groups most similar to Immigrants from Lithuania are Immigrants from Japan (5.2%, a difference of 0.030%), Armenian (5.2%, a difference of 0.36%), Immigrants from Austria (5.2%, a difference of 0.42%), Thai (5.2%, a difference of 0.47%), and Bhutanese (5.3%, a difference of 0.51%).
| Demographics | Rating | Rank | Single Mother Households |
| Chinese | 99.9 /100 | #19 | Exceptional 5.2% |
| Maltese | 99.9 /100 | #20 | Exceptional 5.2% |
| Eastern Europeans | 99.8 /100 | #21 | Exceptional 5.2% |
| Thais | 99.8 /100 | #22 | Exceptional 5.2% |
| Immigrants | Austria | 99.8 /100 | #23 | Exceptional 5.2% |
| Armenians | 99.8 /100 | #24 | Exceptional 5.2% |
| Immigrants | Japan | 99.8 /100 | #25 | Exceptional 5.2% |
| Immigrants | Lithuania | 99.8 /100 | #26 | Exceptional 5.3% |
| Bhutanese | 99.7 /100 | #27 | Exceptional 5.3% |
| Russians | 99.7 /100 | #28 | Exceptional 5.3% |
| Latvians | 99.7 /100 | #29 | Exceptional 5.3% |
| Burmese | 99.7 /100 | #30 | Exceptional 5.3% |
| Immigrants | Korea | 99.7 /100 | #31 | Exceptional 5.3% |
| Cambodians | 99.7 /100 | #32 | Exceptional 5.3% |
| Immigrants | Switzerland | 99.7 /100 | #33 | Exceptional 5.3% |