Assyrian/Chaldean/Syriac vs Immigrants from Lithuania Female Poverty Among 25-34 Year Olds
COMPARE
Assyrian/Chaldean/Syriac
Immigrants from Lithuania
Female Poverty Among 25-34 Year Olds
Female Poverty Among 25-34 Year Olds Comparison
Assyrians/Chaldeans/Syriacs
Immigrants from Lithuania
11.2%
FEMALE POVERTY AMONG 25-34 YEAR OLDS
100.0/ 100
METRIC RATING
15th/ 347
METRIC RANK
11.1%
FEMALE POVERTY AMONG 25-34 YEAR OLDS
100.0/ 100
METRIC RATING
10th/ 347
METRIC RANK
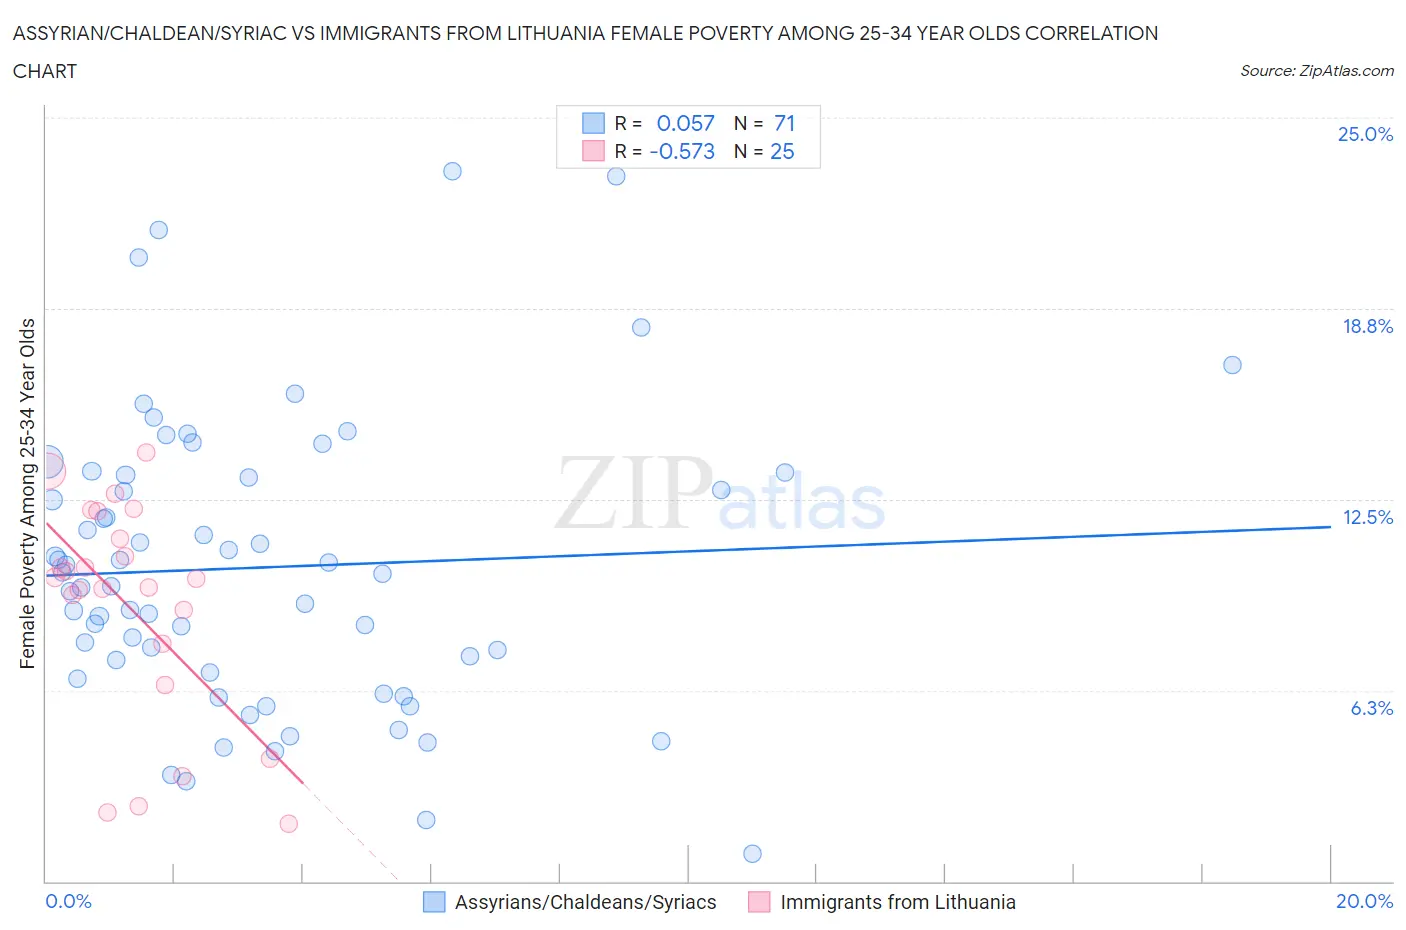
Assyrian/Chaldean/Syriac vs Immigrants from Lithuania Female Poverty Among 25-34 Year Olds Correlation Chart
The statistical analysis conducted on geographies consisting of 109,704,517 people shows a slight positive correlation between the proportion of Assyrians/Chaldeans/Syriacs and poverty level among females between the ages 25 and 34 in the United States with a correlation coefficient (R) of 0.057 and weighted average of 11.2%. Similarly, the statistical analysis conducted on geographies consisting of 116,852,532 people shows a substantial negative correlation between the proportion of Immigrants from Lithuania and poverty level among females between the ages 25 and 34 in the United States with a correlation coefficient (R) of -0.573 and weighted average of 11.1%, a difference of 0.78%.
Female Poverty Among 25-34 Year Olds Correlation Summary
| Measurement | Assyrian/Chaldean/Syriac | Immigrants from Lithuania |
| Minimum | 0.92% | 1.9% |
| Maximum | 23.2% | 14.0% |
| Range | 22.3% | 12.2% |
| Mean | 10.3% | 9.0% |
| Median | 10.1% | 9.9% |
| Interquartile 25% (IQ1) | 6.8% | 7.1% |
| Interquartile 75% (IQ3) | 13.3% | 11.7% |
| Interquartile Range (IQR) | 6.5% | 4.6% |
| Standard Deviation (Sample) | 4.7% | 3.6% |
| Standard Deviation (Population) | 4.7% | 3.5% |
Demographics Similar to Assyrians/Chaldeans/Syriacs and Immigrants from Lithuania by Female Poverty Among 25-34 Year Olds
In terms of female poverty among 25-34 year olds, the demographic groups most similar to Assyrians/Chaldeans/Syriacs are Immigrants from Bolivia (11.2%, a difference of 0.040%), Burmese (11.2%, a difference of 0.11%), Indian (Asian) (11.2%, a difference of 0.11%), Immigrants from China (11.2%, a difference of 0.11%), and Immigrants from Ireland (11.2%, a difference of 0.22%). Similarly, the demographic groups most similar to Immigrants from Lithuania are Immigrants from Singapore (11.1%, a difference of 0.16%), Immigrants from Korea (11.1%, a difference of 0.43%), Immigrants from Iran (11.0%, a difference of 0.53%), Immigrants from Ireland (11.2%, a difference of 0.56%), and Burmese (11.2%, a difference of 0.67%).
| Demographics | Rating | Rank | Female Poverty Among 25-34 Year Olds |
| Immigrants | Taiwan | 100.0 /100 | #2 | Exceptional 10.0% |
| Filipinos | 100.0 /100 | #3 | Exceptional 10.2% |
| Thais | 100.0 /100 | #4 | Exceptional 10.2% |
| Immigrants | Hong Kong | 100.0 /100 | #5 | Exceptional 10.4% |
| Immigrants | South Central Asia | 100.0 /100 | #6 | Exceptional 10.8% |
| Chinese | 100.0 /100 | #7 | Exceptional 11.0% |
| Immigrants | Iran | 100.0 /100 | #8 | Exceptional 11.0% |
| Immigrants | Singapore | 100.0 /100 | #9 | Exceptional 11.1% |
| Immigrants | Lithuania | 100.0 /100 | #10 | Exceptional 11.1% |
| Immigrants | Korea | 100.0 /100 | #11 | Exceptional 11.1% |
| Immigrants | Ireland | 100.0 /100 | #12 | Exceptional 11.2% |
| Burmese | 100.0 /100 | #13 | Exceptional 11.2% |
| Indians (Asian) | 100.0 /100 | #14 | Exceptional 11.2% |
| Assyrians/Chaldeans/Syriacs | 100.0 /100 | #15 | Exceptional 11.2% |
| Immigrants | Bolivia | 100.0 /100 | #16 | Exceptional 11.2% |
| Immigrants | China | 100.0 /100 | #17 | Exceptional 11.2% |
| Immigrants | Eastern Asia | 100.0 /100 | #18 | Exceptional 11.2% |
| Iranians | 100.0 /100 | #19 | Exceptional 11.2% |
| Okinawans | 100.0 /100 | #20 | Exceptional 11.3% |
| Turks | 100.0 /100 | #21 | Exceptional 11.4% |
| Asians | 99.9 /100 | #22 | Exceptional 11.4% |