Venezuelan vs Immigrants from Lithuania Single Mother Households
COMPARE
Venezuelan
Immigrants from Lithuania
Single Mother Households
Single Mother Households Comparison
Venezuelans
Immigrants from Lithuania
6.6%
SINGLE MOTHER HOUSEHOLDS
12.9/ 100
METRIC RATING
201st/ 347
METRIC RANK
5.3%
SINGLE MOTHER HOUSEHOLDS
99.8/ 100
METRIC RATING
26th/ 347
METRIC RANK
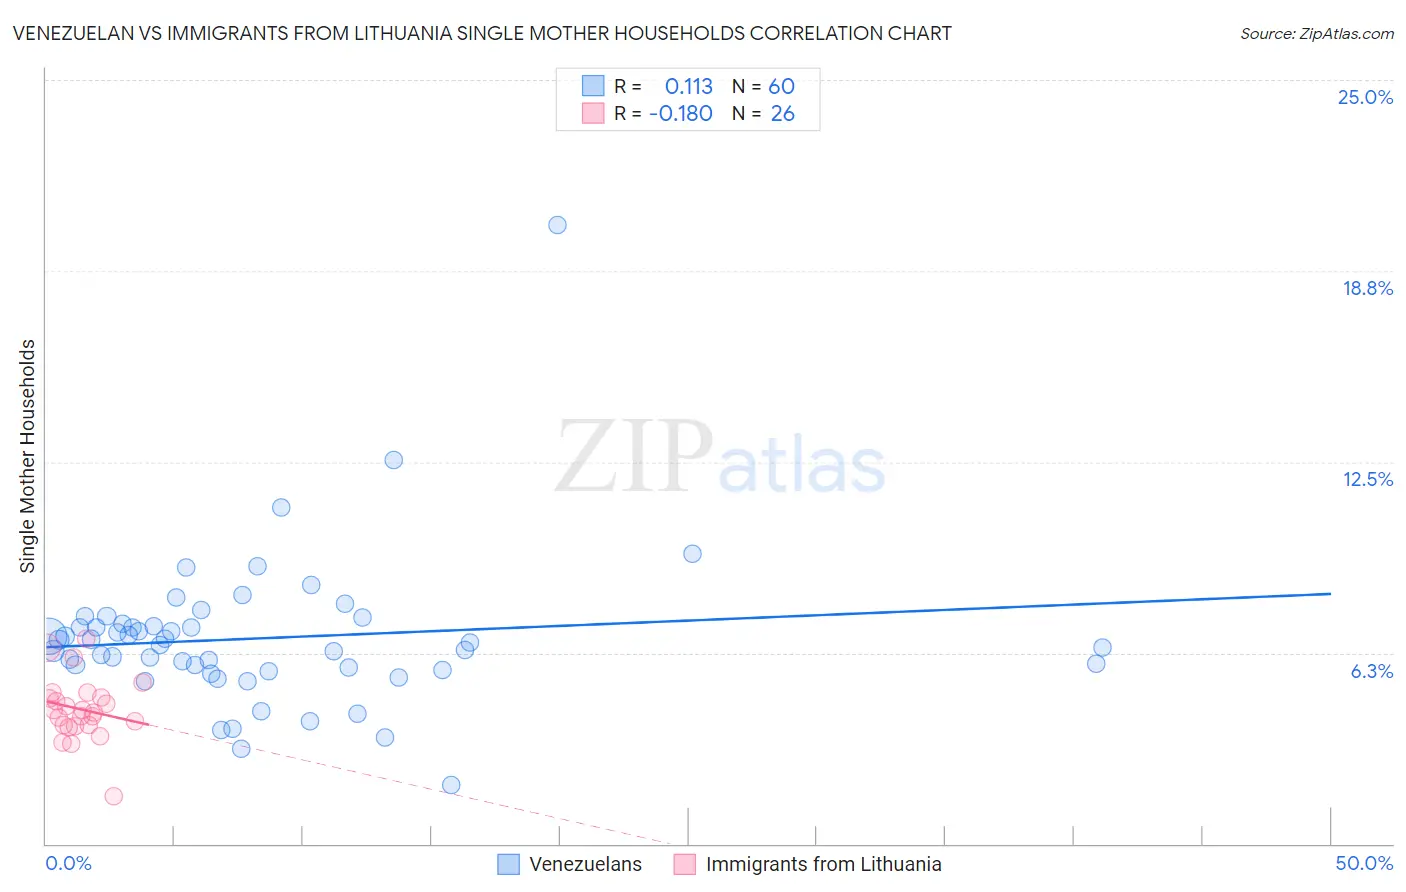
Venezuelan vs Immigrants from Lithuania Single Mother Households Correlation Chart
The statistical analysis conducted on geographies consisting of 305,713,790 people shows a poor positive correlation between the proportion of Venezuelans and percentage of single mother households in the United States with a correlation coefficient (R) of 0.113 and weighted average of 6.6%. Similarly, the statistical analysis conducted on geographies consisting of 117,657,172 people shows a poor negative correlation between the proportion of Immigrants from Lithuania and percentage of single mother households in the United States with a correlation coefficient (R) of -0.180 and weighted average of 5.3%, a difference of 26.5%.
Single Mother Households Correlation Summary
| Measurement | Venezuelan | Immigrants from Lithuania |
| Minimum | 1.9% | 1.5% |
| Maximum | 20.3% | 6.7% |
| Range | 18.4% | 5.2% |
| Mean | 6.7% | 4.4% |
| Median | 6.6% | 4.3% |
| Interquartile 25% (IQ1) | 5.7% | 3.9% |
| Interquartile 75% (IQ3) | 7.2% | 4.8% |
| Interquartile Range (IQR) | 1.4% | 0.89% |
| Standard Deviation (Sample) | 2.5% | 1.0% |
| Standard Deviation (Population) | 2.5% | 1.0% |
Similar Demographics by Single Mother Households
Demographics Similar to Venezuelans by Single Mother Households
In terms of single mother households, the demographic groups most similar to Venezuelans are Guamanian/Chamorro (6.6%, a difference of 0.12%), Immigrants from Peru (6.7%, a difference of 0.21%), Immigrants from Fiji (6.7%, a difference of 0.22%), Cree (6.7%, a difference of 0.24%), and German Russian (6.7%, a difference of 0.32%).
| Demographics | Rating | Rank | Single Mother Households |
| Immigrants | Uganda | 18.3 /100 | #194 | Poor 6.6% |
| South Americans | 18.0 /100 | #195 | Poor 6.6% |
| Uruguayans | 18.0 /100 | #196 | Poor 6.6% |
| Moroccans | 17.4 /100 | #197 | Poor 6.6% |
| Hawaiians | 16.1 /100 | #198 | Poor 6.6% |
| Potawatomi | 15.5 /100 | #199 | Poor 6.6% |
| Immigrants | Ethiopia | 14.7 /100 | #200 | Poor 6.6% |
| Venezuelans | 12.9 /100 | #201 | Poor 6.6% |
| Guamanians/Chamorros | 12.4 /100 | #202 | Poor 6.6% |
| Immigrants | Peru | 12.0 /100 | #203 | Poor 6.7% |
| Immigrants | Fiji | 11.9 /100 | #204 | Poor 6.7% |
| Cree | 11.9 /100 | #205 | Poor 6.7% |
| German Russians | 11.5 /100 | #206 | Poor 6.7% |
| Immigrants | South America | 11.5 /100 | #207 | Poor 6.7% |
| Vietnamese | 11.3 /100 | #208 | Poor 6.7% |
Demographics Similar to Immigrants from Lithuania by Single Mother Households
In terms of single mother households, the demographic groups most similar to Immigrants from Lithuania are Immigrants from Japan (5.2%, a difference of 0.030%), Armenian (5.2%, a difference of 0.36%), Immigrants from Austria (5.2%, a difference of 0.42%), Thai (5.2%, a difference of 0.47%), and Bhutanese (5.3%, a difference of 0.51%).
| Demographics | Rating | Rank | Single Mother Households |
| Chinese | 99.9 /100 | #19 | Exceptional 5.2% |
| Maltese | 99.9 /100 | #20 | Exceptional 5.2% |
| Eastern Europeans | 99.8 /100 | #21 | Exceptional 5.2% |
| Thais | 99.8 /100 | #22 | Exceptional 5.2% |
| Immigrants | Austria | 99.8 /100 | #23 | Exceptional 5.2% |
| Armenians | 99.8 /100 | #24 | Exceptional 5.2% |
| Immigrants | Japan | 99.8 /100 | #25 | Exceptional 5.2% |
| Immigrants | Lithuania | 99.8 /100 | #26 | Exceptional 5.3% |
| Bhutanese | 99.7 /100 | #27 | Exceptional 5.3% |
| Russians | 99.7 /100 | #28 | Exceptional 5.3% |
| Latvians | 99.7 /100 | #29 | Exceptional 5.3% |
| Burmese | 99.7 /100 | #30 | Exceptional 5.3% |
| Immigrants | Korea | 99.7 /100 | #31 | Exceptional 5.3% |
| Cambodians | 99.7 /100 | #32 | Exceptional 5.3% |
| Immigrants | Switzerland | 99.7 /100 | #33 | Exceptional 5.3% |