Armenian vs Immigrants from India Currently Married
COMPARE
Armenian
Immigrants from India
Currently Married
Currently Married Comparison
Armenians
Immigrants from India
46.8%
CURRENTLY MARRIED
58.2/ 100
METRIC RATING
169th/ 347
METRIC RANK
51.8%
CURRENTLY MARRIED
100.0/ 100
METRIC RATING
1st/ 347
METRIC RANK
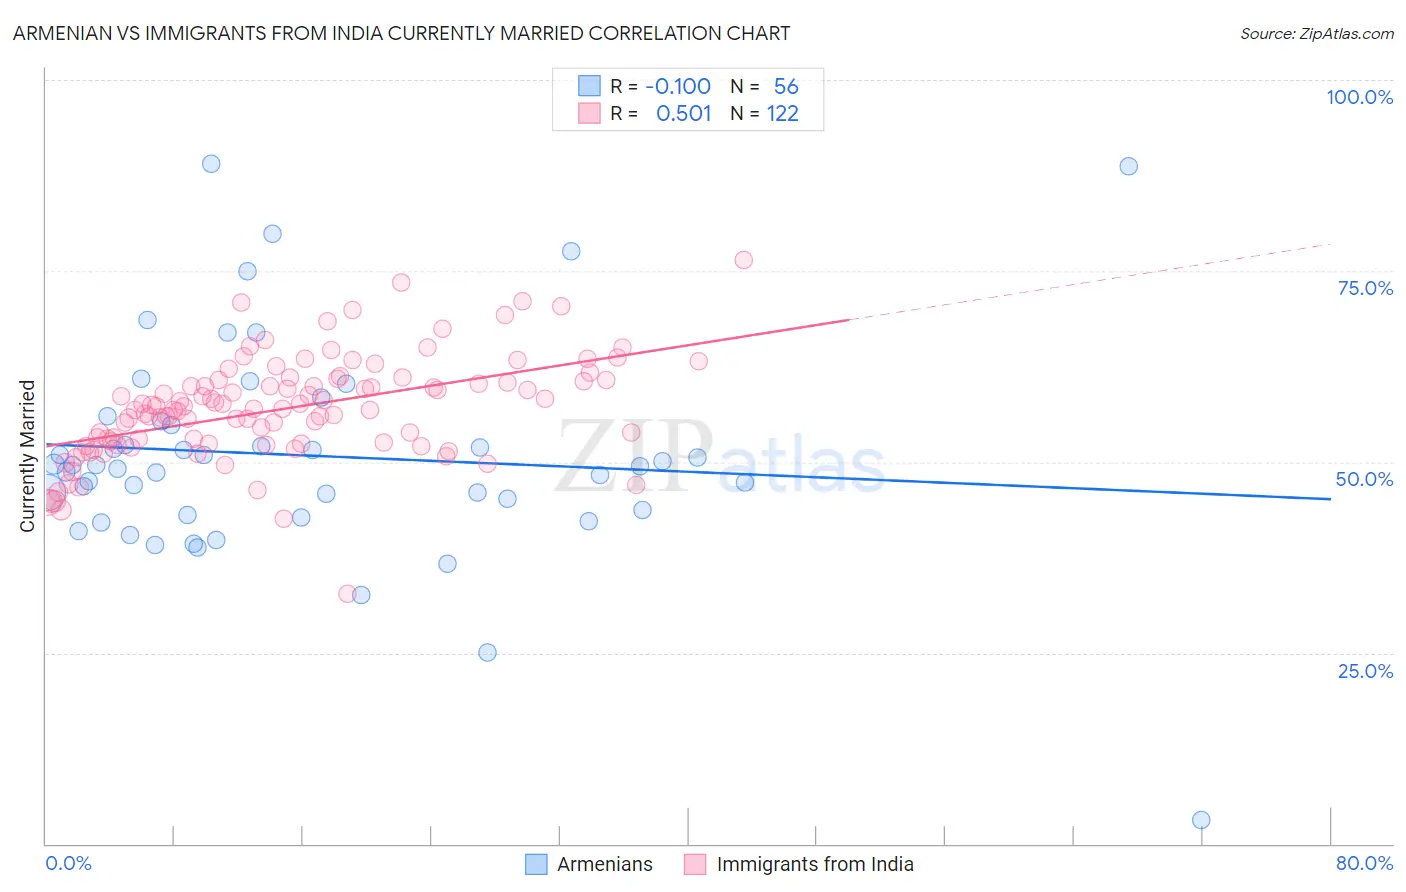
Armenian vs Immigrants from India Currently Married Correlation Chart
The statistical analysis conducted on geographies consisting of 310,938,926 people shows a poor negative correlation between the proportion of Armenians and percentage of population currently married in the United States with a correlation coefficient (R) of -0.100 and weighted average of 46.8%. Similarly, the statistical analysis conducted on geographies consisting of 434,052,762 people shows a substantial positive correlation between the proportion of Immigrants from India and percentage of population currently married in the United States with a correlation coefficient (R) of 0.501 and weighted average of 51.8%, a difference of 10.7%.
Currently Married Correlation Summary
| Measurement | Armenian | Immigrants from India |
| Minimum | 3.1% | 32.7% |
| Maximum | 89.1% | 76.4% |
| Range | 86.0% | 43.7% |
| Mean | 50.8% | 57.0% |
| Median | 49.5% | 56.9% |
| Interquartile 25% (IQ1) | 43.4% | 52.4% |
| Interquartile 75% (IQ3) | 55.1% | 60.7% |
| Interquartile Range (IQR) | 11.7% | 8.3% |
| Standard Deviation (Sample) | 14.2% | 6.8% |
| Standard Deviation (Population) | 14.0% | 6.8% |
Similar Demographics by Currently Married
Demographics Similar to Armenians by Currently Married
In terms of currently married, the demographic groups most similar to Armenians are Immigrants from Afghanistan (46.8%, a difference of 0.0%), Spaniard (46.8%, a difference of 0.020%), Immigrants from Syria (46.8%, a difference of 0.040%), Immigrants from Latvia (46.7%, a difference of 0.050%), and Samoan (46.8%, a difference of 0.060%).
| Demographics | Rating | Rank | Currently Married |
| Immigrants | Nonimmigrants | 65.4 /100 | #162 | Good 46.9% |
| Delaware | 64.7 /100 | #163 | Good 46.9% |
| Immigrants | Western Asia | 64.2 /100 | #164 | Good 46.9% |
| Samoans | 59.8 /100 | #165 | Average 46.8% |
| Immigrants | Syria | 59.3 /100 | #166 | Average 46.8% |
| Spaniards | 58.8 /100 | #167 | Average 46.8% |
| Immigrants | Afghanistan | 58.2 /100 | #168 | Average 46.8% |
| Armenians | 58.2 /100 | #169 | Average 46.8% |
| Immigrants | Latvia | 56.7 /100 | #170 | Average 46.7% |
| Immigrants | Zimbabwe | 52.4 /100 | #171 | Average 46.7% |
| Aleuts | 52.0 /100 | #172 | Average 46.7% |
| Tlingit-Haida | 51.2 /100 | #173 | Average 46.7% |
| Peruvians | 50.0 /100 | #174 | Average 46.6% |
| Immigrants | Brazil | 49.9 /100 | #175 | Average 46.6% |
| Hawaiians | 48.6 /100 | #176 | Average 46.6% |
Demographics Similar to Immigrants from India by Currently Married
In terms of currently married, the demographic groups most similar to Immigrants from India are Thai (50.9%, a difference of 1.8%), Assyrian/Chaldean/Syriac (50.8%, a difference of 1.9%), Immigrants from Taiwan (50.7%, a difference of 2.0%), Danish (50.5%, a difference of 2.6%), and Norwegian (50.2%, a difference of 3.1%).
| Demographics | Rating | Rank | Currently Married |
| Immigrants | India | 100.0 /100 | #1 | Exceptional 51.8% |
| Thais | 100.0 /100 | #2 | Exceptional 50.9% |
| Assyrians/Chaldeans/Syriacs | 100.0 /100 | #3 | Exceptional 50.8% |
| Immigrants | Taiwan | 100.0 /100 | #4 | Exceptional 50.7% |
| Danes | 100.0 /100 | #5 | Exceptional 50.5% |
| Norwegians | 100.0 /100 | #6 | Exceptional 50.2% |
| Immigrants | South Central Asia | 100.0 /100 | #7 | Exceptional 50.0% |
| Swedes | 100.0 /100 | #8 | Exceptional 50.0% |
| Czechs | 99.9 /100 | #9 | Exceptional 49.9% |
| Filipinos | 99.9 /100 | #10 | Exceptional 49.7% |
| English | 99.9 /100 | #11 | Exceptional 49.7% |
| Swiss | 99.9 /100 | #12 | Exceptional 49.7% |
| Dutch | 99.9 /100 | #13 | Exceptional 49.6% |
| Germans | 99.9 /100 | #14 | Exceptional 49.6% |
| Pennsylvania Germans | 99.9 /100 | #15 | Exceptional 49.6% |