Armenian vs Immigrants from India In Labor Force | Age 35-44
COMPARE
Armenian
Immigrants from India
In Labor Force | Age 35-44
In Labor Force | Age 35-44 Comparison
Armenians
Immigrants from India
84.3%
IN LABOR FORCE | AGE 35-44
35.6/ 100
METRIC RATING
184th/ 347
METRIC RANK
85.3%
IN LABOR FORCE | AGE 35-44
99.9/ 100
METRIC RATING
32nd/ 347
METRIC RANK
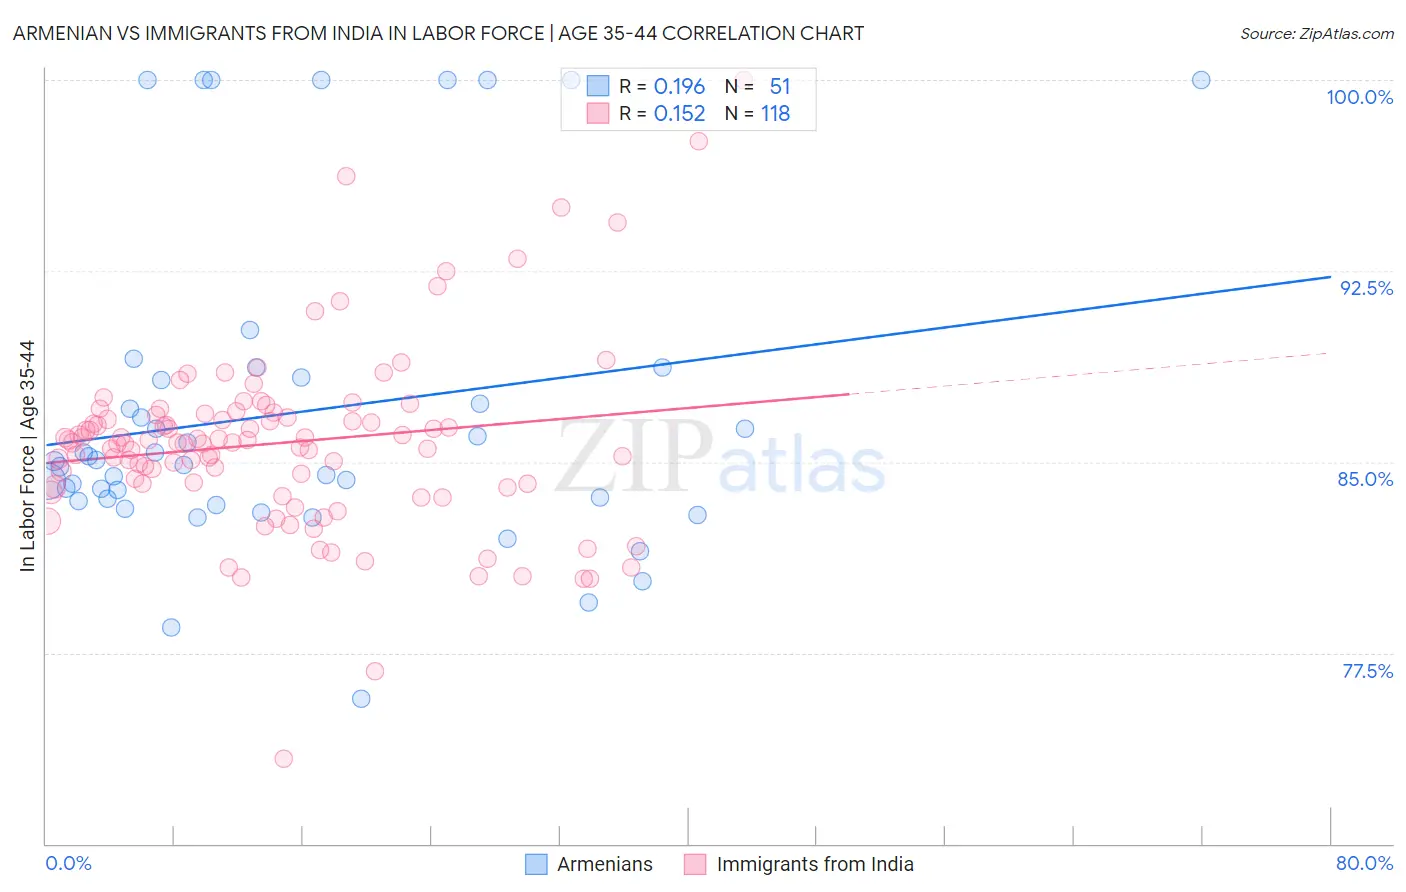
Armenian vs Immigrants from India In Labor Force | Age 35-44 Correlation Chart
The statistical analysis conducted on geographies consisting of 310,840,291 people shows a poor positive correlation between the proportion of Armenians and labor force participation rate among population between the ages 35 and 44 in the United States with a correlation coefficient (R) of 0.196 and weighted average of 84.3%. Similarly, the statistical analysis conducted on geographies consisting of 433,829,652 people shows a poor positive correlation between the proportion of Immigrants from India and labor force participation rate among population between the ages 35 and 44 in the United States with a correlation coefficient (R) of 0.152 and weighted average of 85.3%, a difference of 1.2%.
In Labor Force | Age 35-44 Correlation Summary
| Measurement | Armenian | Immigrants from India |
| Minimum | 75.7% | 73.3% |
| Maximum | 100.0% | 100.0% |
| Range | 24.3% | 26.7% |
| Mean | 86.9% | 85.7% |
| Median | 85.0% | 85.8% |
| Interquartile 25% (IQ1) | 83.5% | 84.1% |
| Interquartile 75% (IQ3) | 88.3% | 86.8% |
| Interquartile Range (IQR) | 4.9% | 2.7% |
| Standard Deviation (Sample) | 6.3% | 3.6% |
| Standard Deviation (Population) | 6.2% | 3.6% |
Similar Demographics by In Labor Force | Age 35-44
Demographics Similar to Armenians by In Labor Force | Age 35-44
In terms of in labor force | age 35-44, the demographic groups most similar to Armenians are Barbadian (84.3%, a difference of 0.0%), Costa Rican (84.3%, a difference of 0.0%), Australian (84.3%, a difference of 0.0%), Immigrants from West Indies (84.3%, a difference of 0.010%), and Korean (84.3%, a difference of 0.010%).
| Demographics | Rating | Rank | In Labor Force | Age 35-44 |
| French Canadians | 44.3 /100 | #177 | Average 84.3% |
| Northern Europeans | 44.1 /100 | #178 | Average 84.3% |
| Immigrants | South Africa | 42.8 /100 | #179 | Average 84.3% |
| Danes | 38.8 /100 | #180 | Fair 84.3% |
| Immigrants | West Indies | 36.4 /100 | #181 | Fair 84.3% |
| Koreans | 36.3 /100 | #182 | Fair 84.3% |
| Barbadians | 36.2 /100 | #183 | Fair 84.3% |
| Armenians | 35.6 /100 | #184 | Fair 84.3% |
| Costa Ricans | 35.3 /100 | #185 | Fair 84.3% |
| Australians | 35.1 /100 | #186 | Fair 84.3% |
| Dutch | 34.8 /100 | #187 | Fair 84.3% |
| South Africans | 34.1 /100 | #188 | Fair 84.3% |
| Immigrants | Denmark | 33.7 /100 | #189 | Fair 84.3% |
| Portuguese | 31.9 /100 | #190 | Fair 84.3% |
| Immigrants | Philippines | 27.9 /100 | #191 | Fair 84.2% |
Demographics Similar to Immigrants from India by In Labor Force | Age 35-44
In terms of in labor force | age 35-44, the demographic groups most similar to Immigrants from India are Bermudan (85.3%, a difference of 0.0%), Czech (85.3%, a difference of 0.0%), Ugandan (85.3%, a difference of 0.010%), Cambodian (85.3%, a difference of 0.020%), and Immigrants from Nepal (85.3%, a difference of 0.030%).
| Demographics | Rating | Rank | In Labor Force | Age 35-44 |
| Paraguayans | 99.9 /100 | #25 | Exceptional 85.4% |
| Immigrants | Liberia | 99.9 /100 | #26 | Exceptional 85.4% |
| Immigrants | Lithuania | 99.9 /100 | #27 | Exceptional 85.4% |
| Immigrants | Greece | 99.9 /100 | #28 | Exceptional 85.3% |
| Cambodians | 99.9 /100 | #29 | Exceptional 85.3% |
| Bermudans | 99.9 /100 | #30 | Exceptional 85.3% |
| Czechs | 99.9 /100 | #31 | Exceptional 85.3% |
| Immigrants | India | 99.9 /100 | #32 | Exceptional 85.3% |
| Ugandans | 99.9 /100 | #33 | Exceptional 85.3% |
| Immigrants | Nepal | 99.9 /100 | #34 | Exceptional 85.3% |
| Estonians | 99.9 /100 | #35 | Exceptional 85.3% |
| Immigrants | Morocco | 99.8 /100 | #36 | Exceptional 85.2% |
| Kenyans | 99.8 /100 | #37 | Exceptional 85.2% |
| Immigrants | Poland | 99.8 /100 | #38 | Exceptional 85.2% |
| Eastern Europeans | 99.8 /100 | #39 | Exceptional 85.2% |