Armenian vs Dutch West Indian Currently Married
COMPARE
Armenian
Dutch West Indian
Currently Married
Currently Married Comparison
Armenians
Dutch West Indians
46.8%
CURRENTLY MARRIED
58.2/ 100
METRIC RATING
169th/ 347
METRIC RANK
45.5%
CURRENTLY MARRIED
6.7/ 100
METRIC RATING
214th/ 347
METRIC RANK
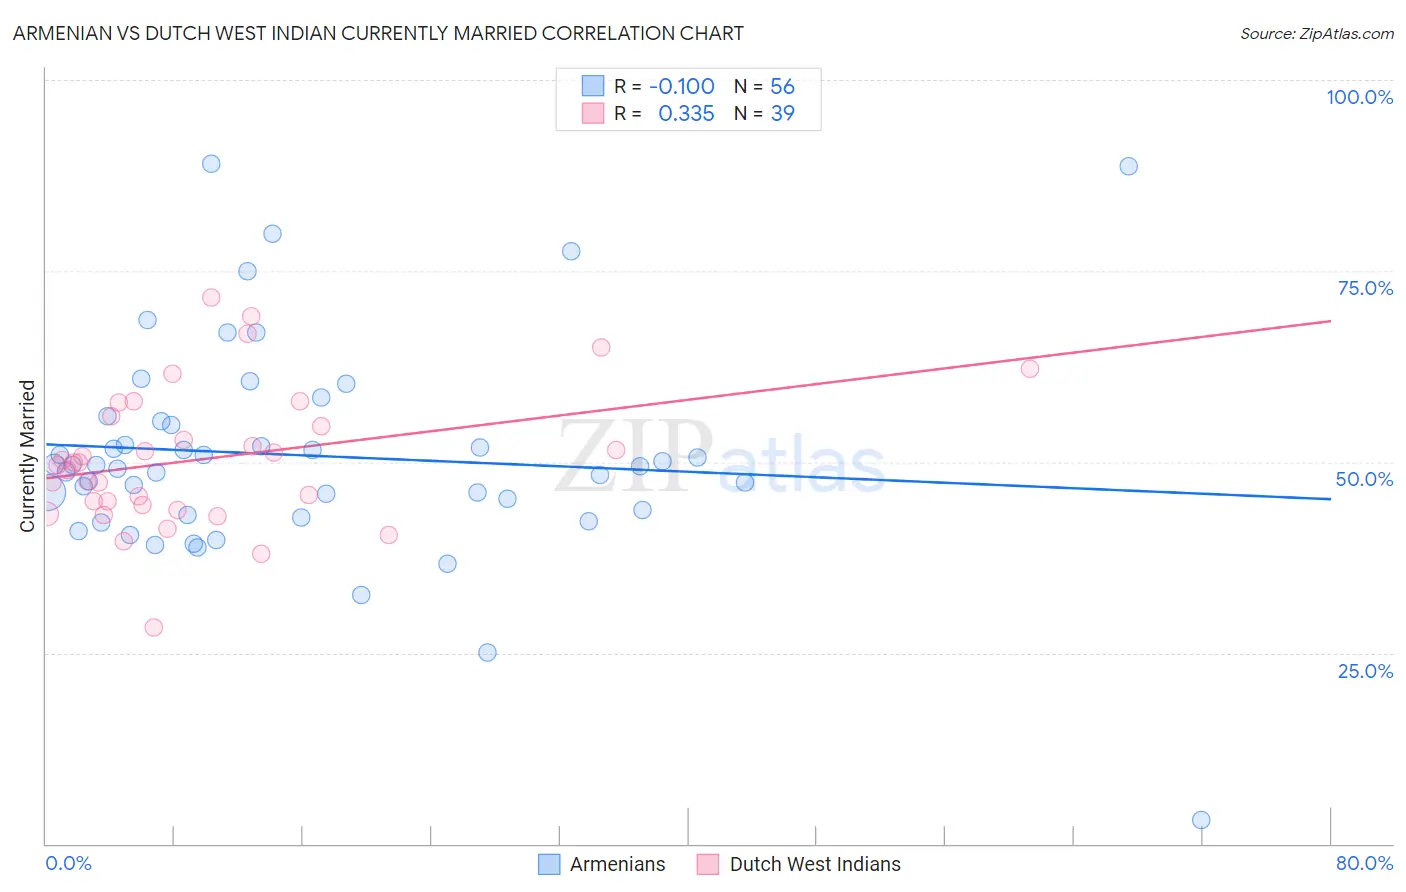
Armenian vs Dutch West Indian Currently Married Correlation Chart
The statistical analysis conducted on geographies consisting of 310,938,926 people shows a poor negative correlation between the proportion of Armenians and percentage of population currently married in the United States with a correlation coefficient (R) of -0.100 and weighted average of 46.8%. Similarly, the statistical analysis conducted on geographies consisting of 85,776,105 people shows a mild positive correlation between the proportion of Dutch West Indians and percentage of population currently married in the United States with a correlation coefficient (R) of 0.335 and weighted average of 45.5%, a difference of 2.8%.
Currently Married Correlation Summary
| Measurement | Armenian | Dutch West Indian |
| Minimum | 3.1% | 28.4% |
| Maximum | 89.1% | 71.6% |
| Range | 86.0% | 43.2% |
| Mean | 50.8% | 50.4% |
| Median | 49.5% | 49.9% |
| Interquartile 25% (IQ1) | 43.4% | 44.3% |
| Interquartile 75% (IQ3) | 55.1% | 55.9% |
| Interquartile Range (IQR) | 11.7% | 11.6% |
| Standard Deviation (Sample) | 14.2% | 9.0% |
| Standard Deviation (Population) | 14.0% | 8.9% |
Similar Demographics by Currently Married
Demographics Similar to Armenians by Currently Married
In terms of currently married, the demographic groups most similar to Armenians are Immigrants from Afghanistan (46.8%, a difference of 0.0%), Spaniard (46.8%, a difference of 0.020%), Immigrants from Syria (46.8%, a difference of 0.040%), Immigrants from Latvia (46.7%, a difference of 0.050%), and Samoan (46.8%, a difference of 0.060%).
| Demographics | Rating | Rank | Currently Married |
| Immigrants | Nonimmigrants | 65.4 /100 | #162 | Good 46.9% |
| Delaware | 64.7 /100 | #163 | Good 46.9% |
| Immigrants | Western Asia | 64.2 /100 | #164 | Good 46.9% |
| Samoans | 59.8 /100 | #165 | Average 46.8% |
| Immigrants | Syria | 59.3 /100 | #166 | Average 46.8% |
| Spaniards | 58.8 /100 | #167 | Average 46.8% |
| Immigrants | Afghanistan | 58.2 /100 | #168 | Average 46.8% |
| Armenians | 58.2 /100 | #169 | Average 46.8% |
| Immigrants | Latvia | 56.7 /100 | #170 | Average 46.7% |
| Immigrants | Zimbabwe | 52.4 /100 | #171 | Average 46.7% |
| Aleuts | 52.0 /100 | #172 | Average 46.7% |
| Tlingit-Haida | 51.2 /100 | #173 | Average 46.7% |
| Peruvians | 50.0 /100 | #174 | Average 46.6% |
| Immigrants | Brazil | 49.9 /100 | #175 | Average 46.6% |
| Hawaiians | 48.6 /100 | #176 | Average 46.6% |
Demographics Similar to Dutch West Indians by Currently Married
In terms of currently married, the demographic groups most similar to Dutch West Indians are German Russian (45.5%, a difference of 0.0%), Alaska Native (45.5%, a difference of 0.040%), Marshallese (45.5%, a difference of 0.070%), Houma (45.5%, a difference of 0.080%), and Uruguayan (45.6%, a difference of 0.16%).
| Demographics | Rating | Rank | Currently Married |
| Immigrants | South America | 10.8 /100 | #207 | Poor 45.7% |
| Alsatians | 10.8 /100 | #208 | Poor 45.7% |
| Immigrants | Micronesia | 8.8 /100 | #209 | Tragic 45.6% |
| Uruguayans | 7.9 /100 | #210 | Tragic 45.6% |
| Houma | 7.2 /100 | #211 | Tragic 45.5% |
| Marshallese | 7.2 /100 | #212 | Tragic 45.5% |
| Alaska Natives | 7.0 /100 | #213 | Tragic 45.5% |
| Dutch West Indians | 6.7 /100 | #214 | Tragic 45.5% |
| German Russians | 6.7 /100 | #215 | Tragic 45.5% |
| Immigrants | Morocco | 5.5 /100 | #216 | Tragic 45.4% |
| Immigrants | Thailand | 5.1 /100 | #217 | Tragic 45.4% |
| Panamanians | 4.0 /100 | #218 | Tragic 45.3% |
| Immigrants | Portugal | 3.5 /100 | #219 | Tragic 45.2% |
| Kenyans | 3.1 /100 | #220 | Tragic 45.2% |
| Mexicans | 3.0 /100 | #221 | Tragic 45.2% |