Armenian vs Puget Sound Salish Currently Married
COMPARE
Armenian
Puget Sound Salish
Currently Married
Currently Married Comparison
Armenians
Puget Sound Salish
46.8%
CURRENTLY MARRIED
58.2/ 100
METRIC RATING
169th/ 347
METRIC RANK
47.6%
CURRENTLY MARRIED
90.3/ 100
METRIC RATING
117th/ 347
METRIC RANK
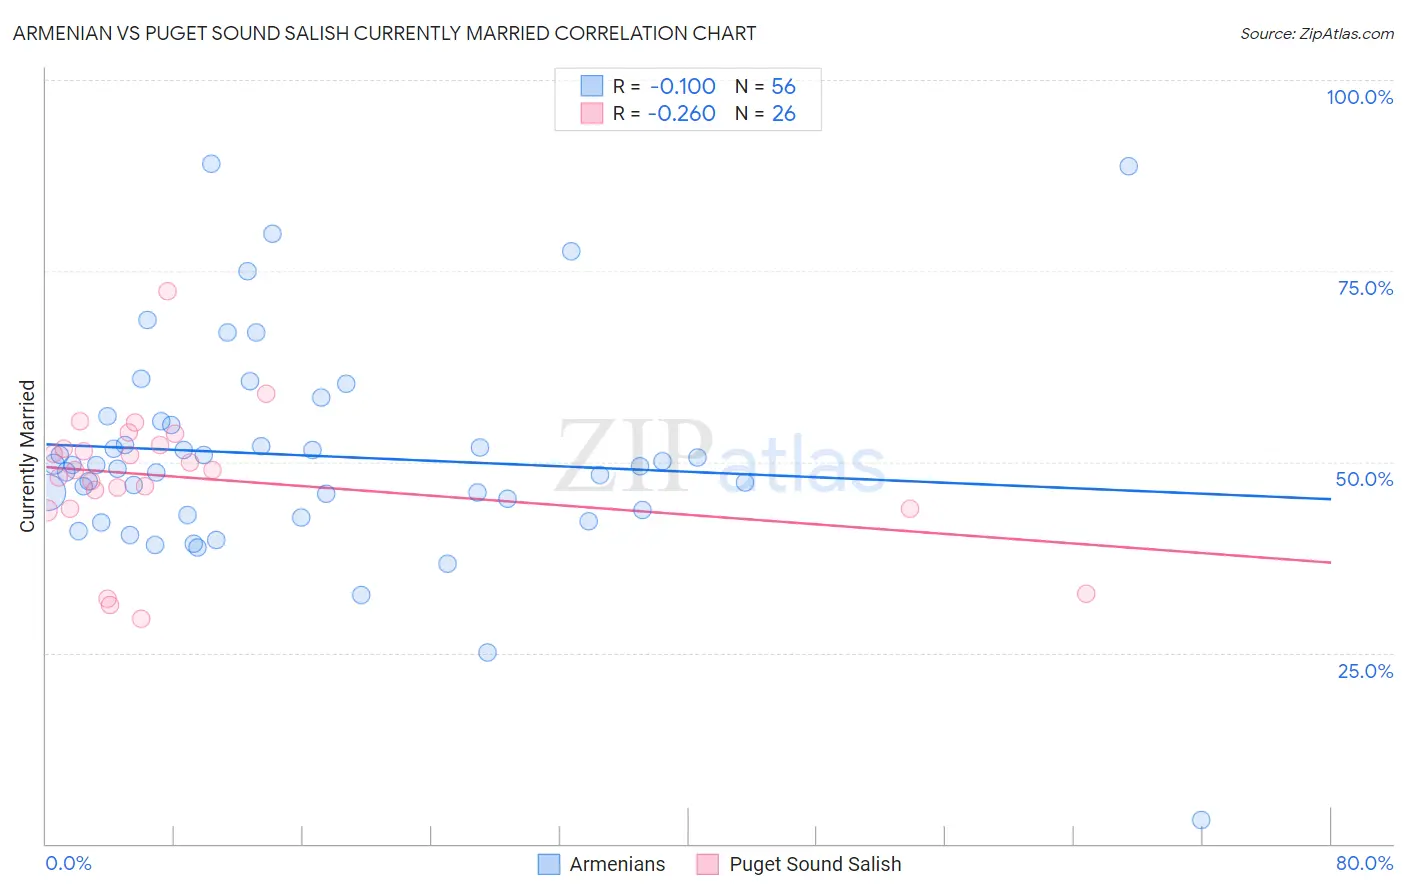
Armenian vs Puget Sound Salish Currently Married Correlation Chart
The statistical analysis conducted on geographies consisting of 310,938,926 people shows a poor negative correlation between the proportion of Armenians and percentage of population currently married in the United States with a correlation coefficient (R) of -0.100 and weighted average of 46.8%. Similarly, the statistical analysis conducted on geographies consisting of 46,155,865 people shows a weak negative correlation between the proportion of Puget Sound Salish and percentage of population currently married in the United States with a correlation coefficient (R) of -0.260 and weighted average of 47.6%, a difference of 1.7%.
Currently Married Correlation Summary
| Measurement | Armenian | Puget Sound Salish |
| Minimum | 3.1% | 29.5% |
| Maximum | 89.1% | 72.4% |
| Range | 86.0% | 42.9% |
| Mean | 50.8% | 47.9% |
| Median | 49.5% | 48.9% |
| Interquartile 25% (IQ1) | 43.4% | 43.9% |
| Interquartile 75% (IQ3) | 55.1% | 52.2% |
| Interquartile Range (IQR) | 11.7% | 8.3% |
| Standard Deviation (Sample) | 14.2% | 9.2% |
| Standard Deviation (Population) | 14.0% | 9.0% |
Similar Demographics by Currently Married
Demographics Similar to Armenians by Currently Married
In terms of currently married, the demographic groups most similar to Armenians are Immigrants from Afghanistan (46.8%, a difference of 0.0%), Spaniard (46.8%, a difference of 0.020%), Immigrants from Syria (46.8%, a difference of 0.040%), Immigrants from Latvia (46.7%, a difference of 0.050%), and Samoan (46.8%, a difference of 0.060%).
| Demographics | Rating | Rank | Currently Married |
| Immigrants | Nonimmigrants | 65.4 /100 | #162 | Good 46.9% |
| Delaware | 64.7 /100 | #163 | Good 46.9% |
| Immigrants | Western Asia | 64.2 /100 | #164 | Good 46.9% |
| Samoans | 59.8 /100 | #165 | Average 46.8% |
| Immigrants | Syria | 59.3 /100 | #166 | Average 46.8% |
| Spaniards | 58.8 /100 | #167 | Average 46.8% |
| Immigrants | Afghanistan | 58.2 /100 | #168 | Average 46.8% |
| Armenians | 58.2 /100 | #169 | Average 46.8% |
| Immigrants | Latvia | 56.7 /100 | #170 | Average 46.7% |
| Immigrants | Zimbabwe | 52.4 /100 | #171 | Average 46.7% |
| Aleuts | 52.0 /100 | #172 | Average 46.7% |
| Tlingit-Haida | 51.2 /100 | #173 | Average 46.7% |
| Peruvians | 50.0 /100 | #174 | Average 46.6% |
| Immigrants | Brazil | 49.9 /100 | #175 | Average 46.6% |
| Hawaiians | 48.6 /100 | #176 | Average 46.6% |
Demographics Similar to Puget Sound Salish by Currently Married
In terms of currently married, the demographic groups most similar to Puget Sound Salish are Immigrants from Philippines (47.6%, a difference of 0.010%), Australian (47.6%, a difference of 0.010%), Immigrants from Indonesia (47.6%, a difference of 0.020%), Palestinian (47.6%, a difference of 0.020%), and South African (47.6%, a difference of 0.030%).
| Demographics | Rating | Rank | Currently Married |
| Immigrants | Russia | 92.0 /100 | #110 | Exceptional 47.7% |
| Immigrants | Hungary | 91.2 /100 | #111 | Exceptional 47.6% |
| Immigrants | Western Europe | 91.1 /100 | #112 | Exceptional 47.6% |
| Immigrants | Denmark | 90.9 /100 | #113 | Exceptional 47.6% |
| South Africans | 90.5 /100 | #114 | Exceptional 47.6% |
| Immigrants | Indonesia | 90.5 /100 | #115 | Exceptional 47.6% |
| Palestinians | 90.4 /100 | #116 | Exceptional 47.6% |
| Puget Sound Salish | 90.3 /100 | #117 | Exceptional 47.6% |
| Immigrants | Philippines | 90.2 /100 | #118 | Exceptional 47.6% |
| Australians | 90.2 /100 | #119 | Exceptional 47.6% |
| Syrians | 88.9 /100 | #120 | Excellent 47.5% |
| Immigrants | Croatia | 88.6 /100 | #121 | Excellent 47.5% |
| Osage | 87.9 /100 | #122 | Excellent 47.5% |
| Immigrants | Kazakhstan | 87.2 /100 | #123 | Excellent 47.4% |
| Laotians | 86.6 /100 | #124 | Excellent 47.4% |